Dear experts,
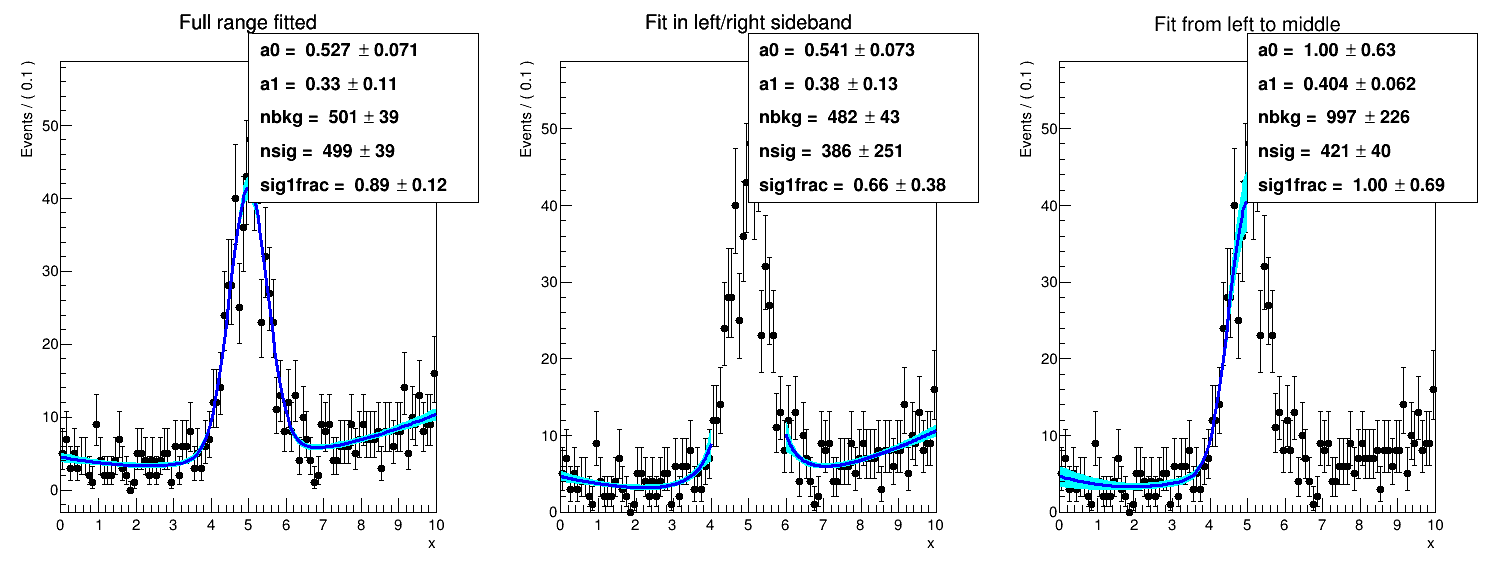
my problem is the following: I am looking for a “peak” over an exponential, smooth background.
The mass window around the signal needs to stay out of the fit and blinded, the idea is to extract the slope of the exponential from the fitting the data sidebands and then calculate the expected background yield using RooExtendPdf and let it figure out the normalisation.
Here’s the code fragment that does it
# fit the data sidebands
results_expo = expo.fitTo(fulldata, ROOT.RooFit.Range('left,right'), ROOT.RooFit.Save())
expo.plotOn(frame, ROOT.RooFit.LineColor(ROOT.kBlack))

# var to store the number of background events
nbkg = ROOT.RooRealVar  ('nbkg', 'bkg n', 10, 0, 100)

# extend the expo to the full range
mass.setRange('full', 1.61, 1.99)
ebkg = ROOT.RooExtendPdf('ebkg', 'ebkg',  expo, nbkg, 'full')

# fit again the sidebands
ebkg.fitTo(fulldata, ROOT.RooFit.Range('left,right'))
ebkg.plotOn(frame, ROOT.RooFit.LineColor(ROOT.kBlue))
Then I would expect the original fit and the second fit to coincide in the plot, but they don’t
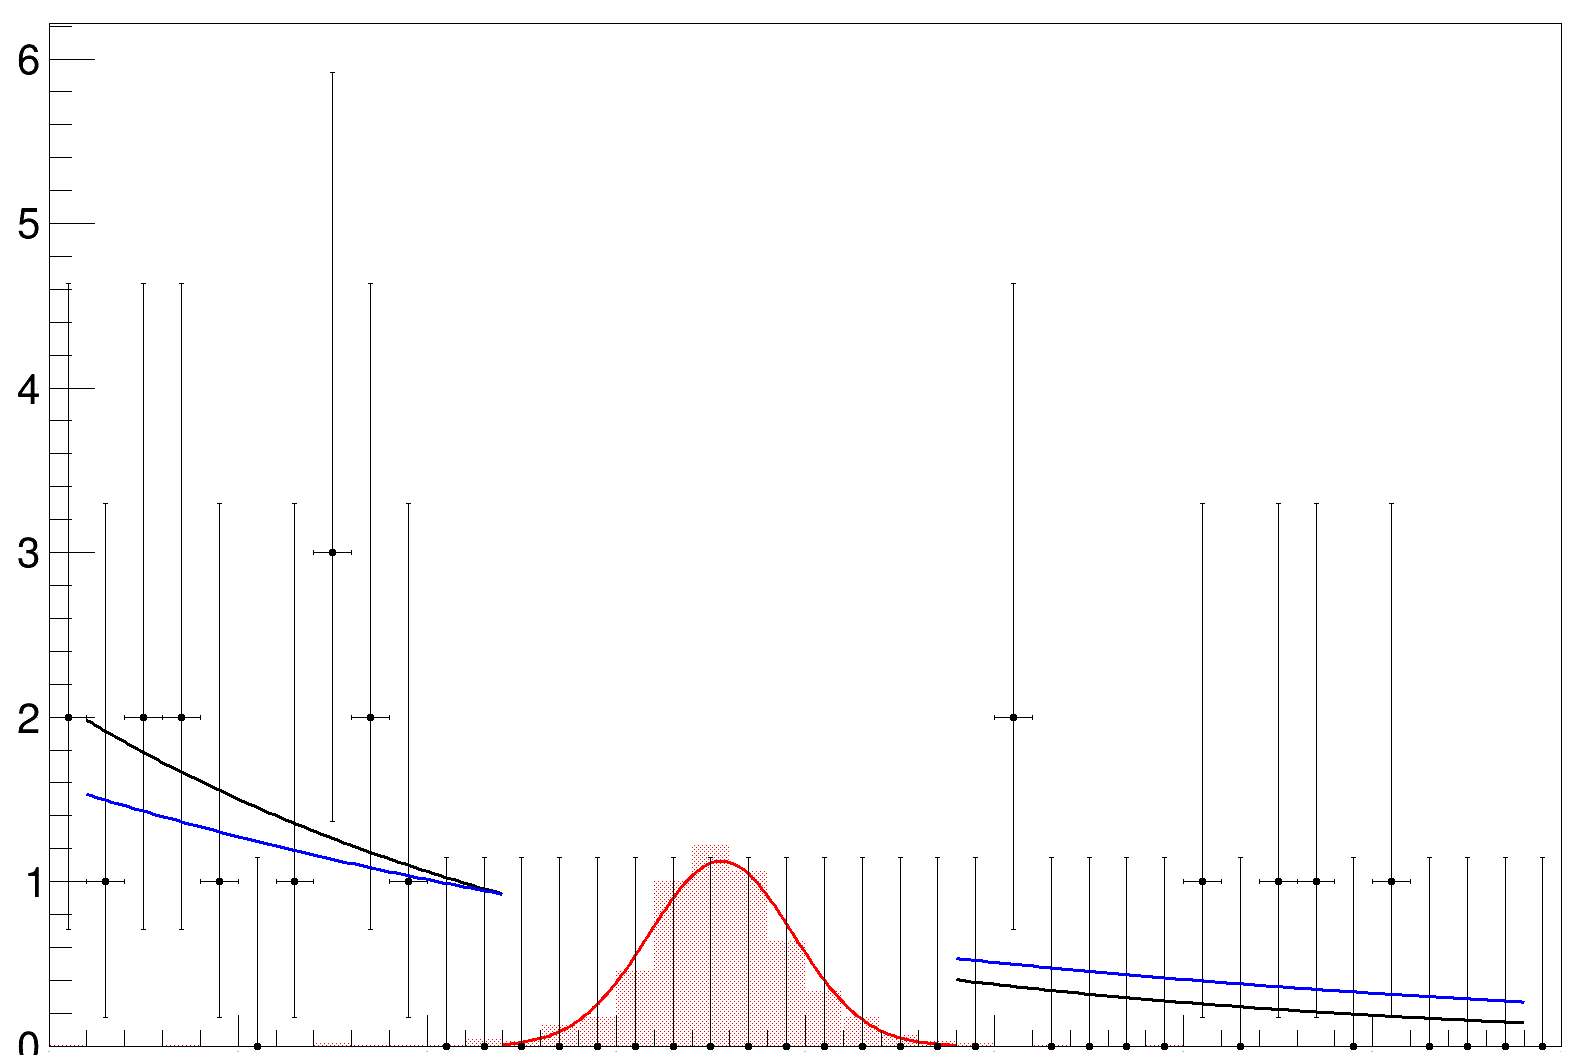
and in fact the slope changes
 **********
  EXT PARAMETER                                INTERNAL      INTERNAL
  NO.   NAME      VALUE            ERROR       STEP SIZE       VALUE
   1  nbkg         2.75083e+01   6.34502e+00   1.83204e-06  -1.55665e+00
   2  slope       -4.58018e+00   1.93502e+00   1.00286e-06   1.56652e+00
vs
 EXT PARAMETER                                   STEP         FIRST
  NO.   NAME      VALUE            ERROR          SIZE      DERIVATIVE
   1  slope       -6.92909e+00   6.53287e+00   1.19188e-05  -1.00018e+00
I cannot understand this behaviour, is there something that I am missing?
I tried to fit the sidebands with plain ROOT and I obtain something close to the blue curve, but, at this point, I am not sure which is the correct option.
Thanks,
Riccardo