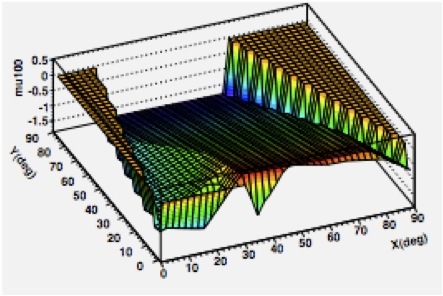
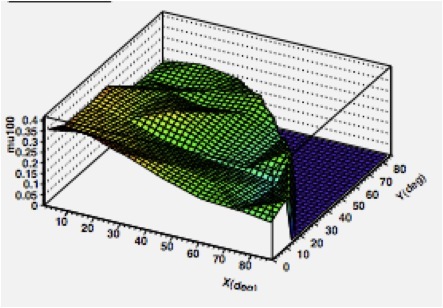
I would like to make a fit of the TGraph2D that you see in Figure 1. When I use a 2D polynomial function I get the result presented in Figure 2. I think that the reason is that part of the area in the graph has no data (the violet area in the plot).
I would like to make a fit only of the area with data. The problem is that it is not a square region that I could define setting the range. Is it possible to define a range using a function instead of fixed values?
In general, does somebody know how to force the fit procedure to ignore the area with no data?
Hello,
the region with no data is always excluded when fitting a TGraph2D.
What you observe is probably that the function is extrapolated in the region with no data and it is drawn in figure 2.
If it makes sense, you can probably change this by
defining better your function, i.e. to be a polynomial in the data region and a null function outside.
I tried to fit just a polynomial function, of the type:
TF2 *f2 = new TF2("f2", "[0]+[1]*x+[2]*x*x+[3]*y+[4]*y*y+[5]*x*y",0.,90,0.,90.);
I tried applying it directly, and also defining it as a user function in the way:
[code]Double_t fitf(Double_t *x, Double_t *par)
{
//x[0] contains the x value
//x[1] contains the y value
//par[6]
// [0]+[1]*x+[2]xx+[3]*y+[4]yy+[5]xy
Double_t fitval(0);
if ( sqrt(x[0]*x[0]+x[1]*x[1])<90. )
{
fitval=par[0]+par[1]*x[0]+par[2]*x[0]*x[0]+par[3]*x[1]+par[4]*x[1]*x[1]+par[5]*x[0]*x[1];
} else {fitval=0;}
return fitval;
}
[/code]
putting in this second case in the body of my program:
TF2 *f2 = new TF2("f2","fitf",0.,90,0.,90.);
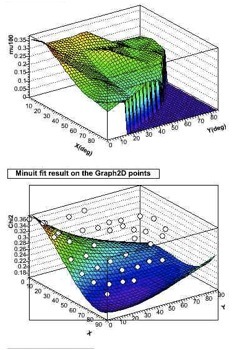
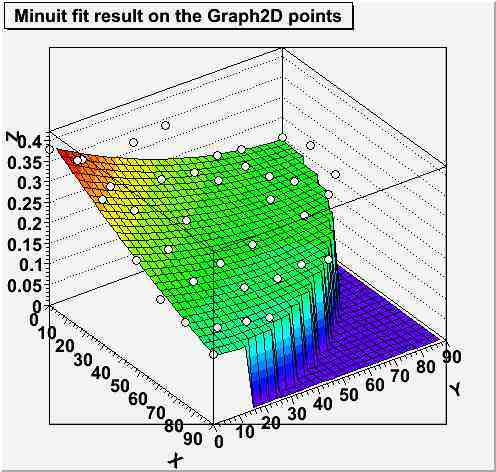
In both cases I get the result of the figure 3. Figure 3a is the distribution that I want to fit. Figure 3b shows the result of the fit function together with the points to be fitted (white dots).
Any suggestion to get a better fit will be welcomed.
graph.root: its the TGraph2D that I posted in previous figure 3b.
grapherr.root: the same, but plotted as TGraph2DErrors.
macro.C: the macro to fit and make the plot of the data.
I send “grapherr.root” just in case that it would work better considering the errors of the data points. I have tried it myself and the result was not better.
The macro reads by default “graph.root”. If you’d like to use the errors, just comment the first two lines and uncomment the following two.
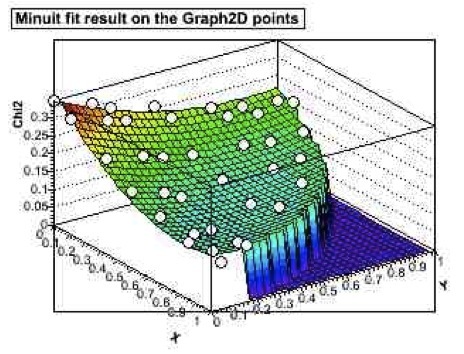
Just a couple of questions related with its graphical representation:
-When I plot the points and the fit together, a thin black line appears as a frame of the graph (see figure below). How can I remove it?
-I’d like to show the scale of the color palette at the side of the graph. How can I do this? I know that when plotting a histogram I can access the palette through TPaletteAxis, but I don’t know how to access this class from a TGraph2D.
I am using root 5.20.00 in a Linux Fedora system, maybe that can make the difference
[code]
*
W E L C O M E to R O O T *
*
Version 5.20/00 24 June 2008 *
*
You are welcome to visit our Web site *
http://root.cern.ch *
*
ROOT 5.20/00 (trunk@24524, Jun 26 2008, 14:53:00 on linux)
CINT/ROOT C/C++ Interpreter version 5.16.29, Jan 08, 2008
Type ? for help. Commands must be C++ statements.
Enclose multiple statements between { }.[/code]
Last question: is there a way to access the TPaletteAxis from the TF2 directly, so that I can define it’s size, position and others? I’ve been able to do it with the intermediate step of creating a histogram, as I show below.
[code] TH2D h = (TH2D)f2->CreateHistogram();
h->Draw(“surf1 Z”);
h->SetTitle(“Minuit fit result on the Graph2D points”);
h->GetXaxis()->SetTitle(“X”);
h->GetXaxis()->SetTitleOffset(2.0);
h->GetYaxis()->SetTitle(“Y”);
h->GetYaxis()->SetTitleOffset(2.0);
h->GetZaxis()->SetTitle(“Z”);
h->GetZaxis()->SetTitleOffset(1.2);
g->Draw(“same p0”);