I am new to root and having a problem in fitting a profile histogram. I projected a 2D histogram from a root file into a profile Histogram along X ( naned it “prof”). Now, I want to fit the profile histogram with a horizontal line. I did:
prof->Fit(“pol0”);
Everything runs smoothly, however the fit line is well above the mean value along Y. I wonder if it has something to do with the fit range taken into consideration. If yes, is there a way I can specify the fit range for the profile histogram?
If any one could point any obvious cause on the script which is causing this, it would be of great help.
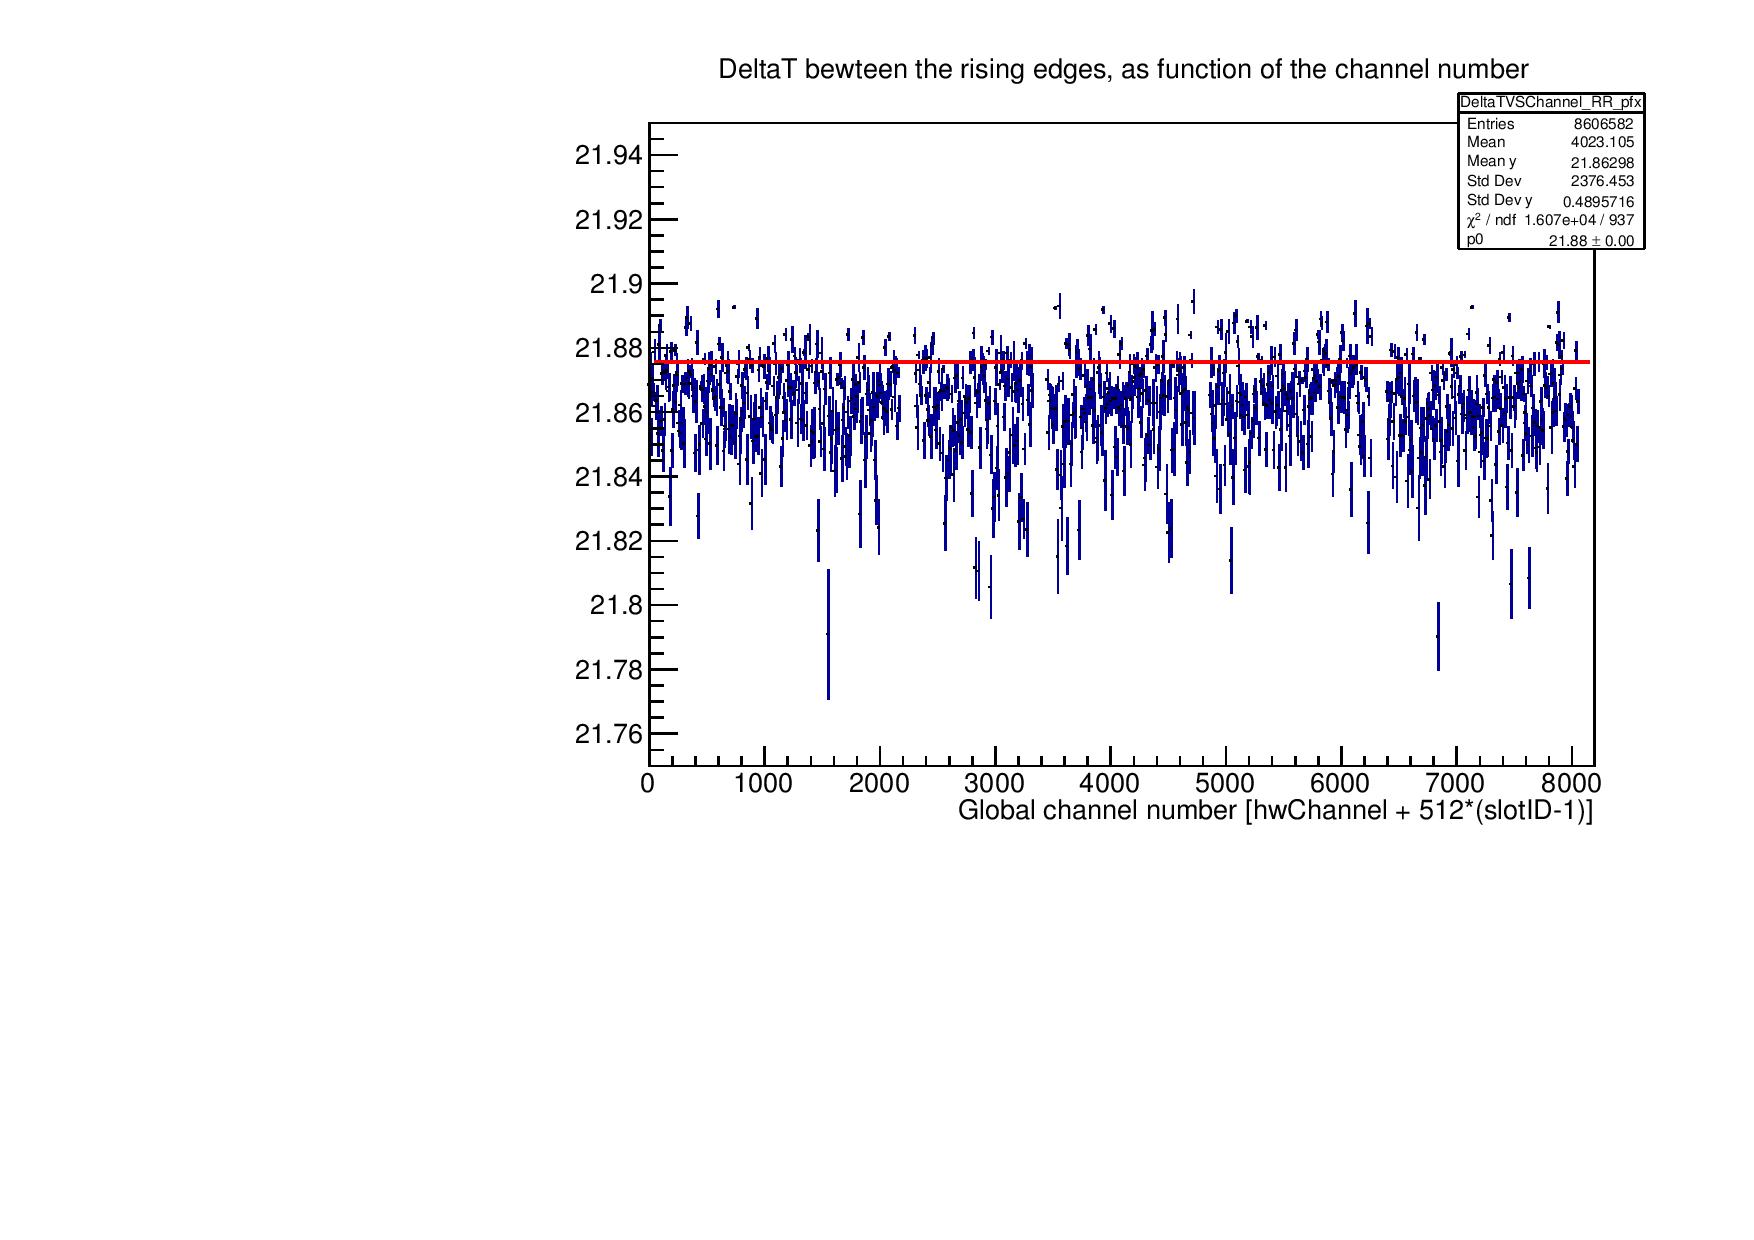
Attached are the macro that I am using, and the histogram I got as a result of the fit .
Looking at the “statistics box”, the raw “Mean y” is 21.86 and the fitted “p0” is 21.88, which seems fine to me. Note that points with higher “y” have smaller errors, so the chi^2 method “prefers” them. You can try with prof->Fit("pol0", "L"); and/or prof->Fit("pol0", "WL"); (and maybe you will need “FL” and “FWL”).
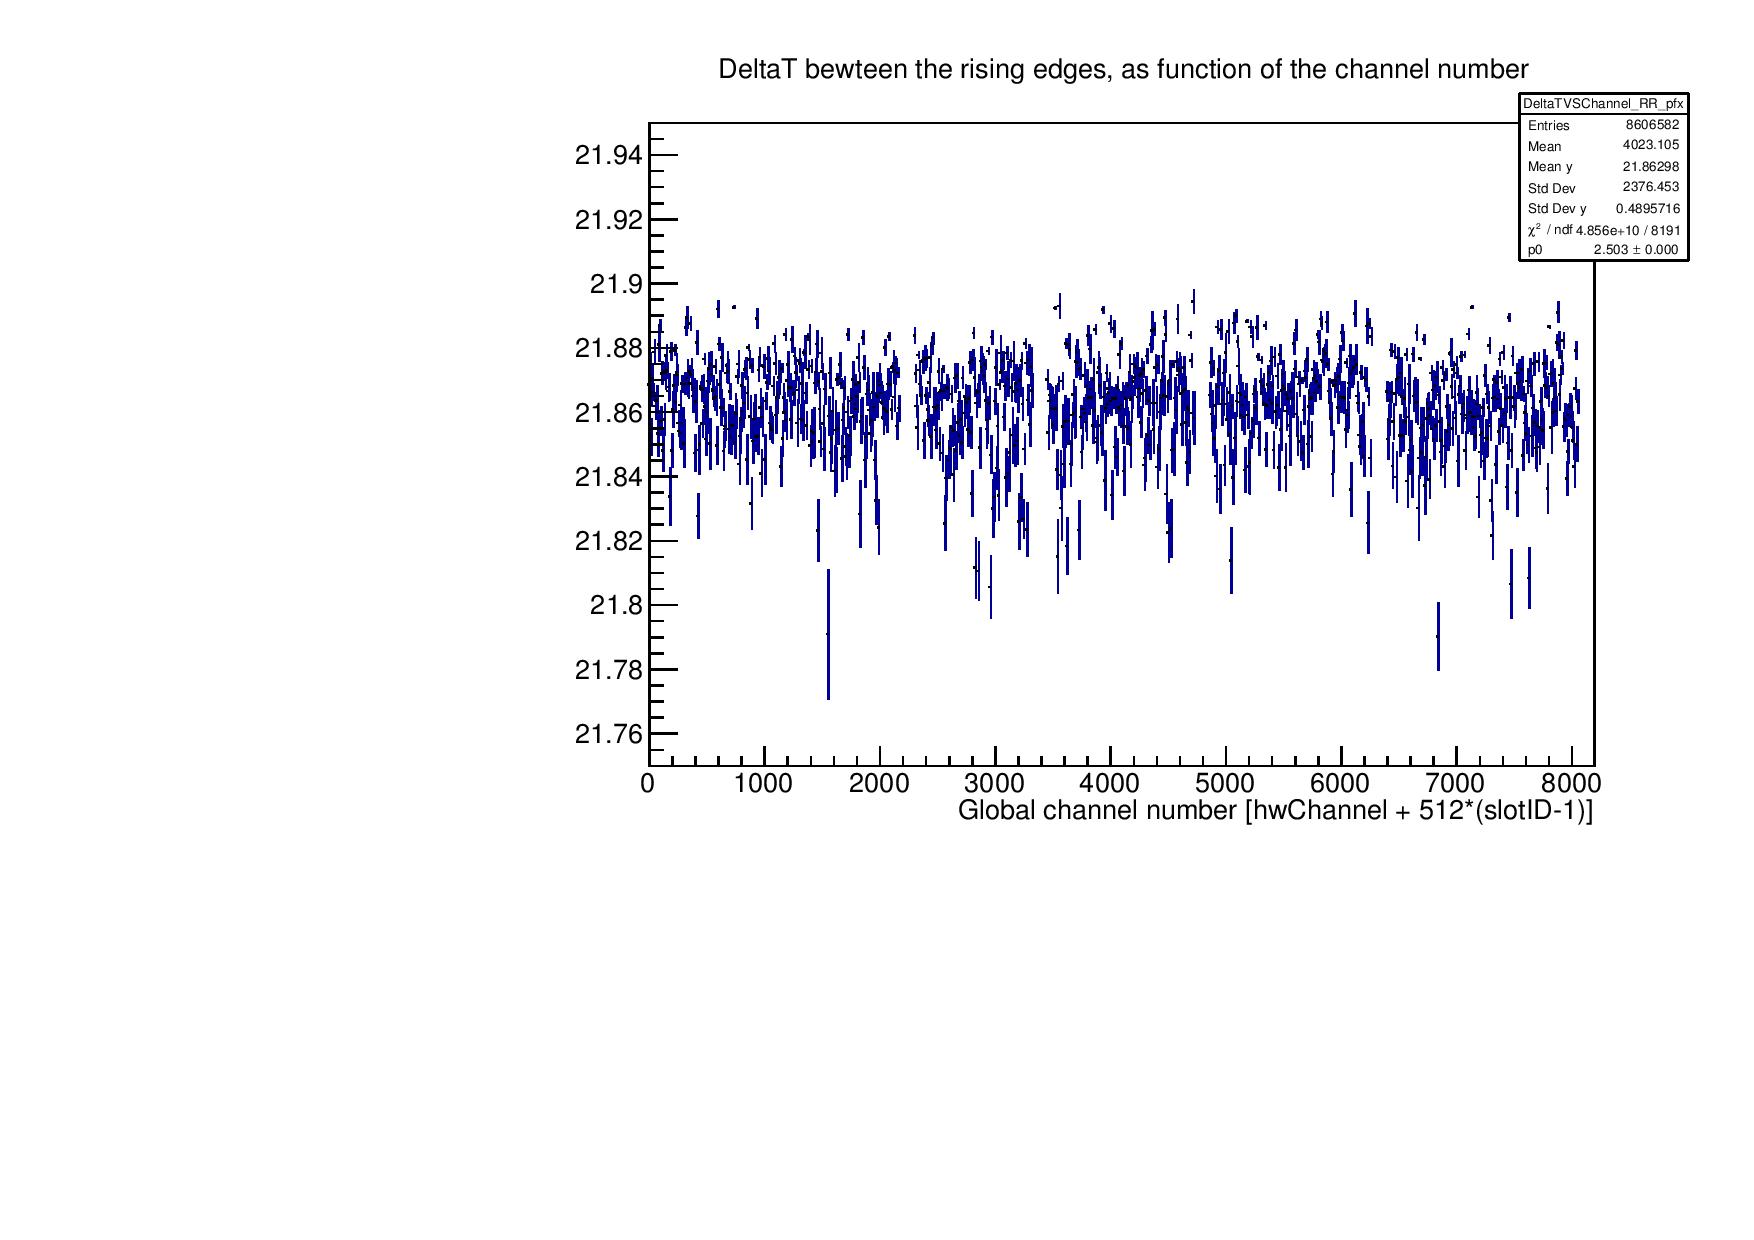
Thank You for your response. I tried with prof->Fit(“pol0”, “L”); and also with prof->Fit(“pol0”, “WL”); prof->Fit(“pol0”, “FL”); prof->Fit(“pol0”, “FWL”); . However, the p0 value I get is 2.503 which is out of range of the histogram and hence is not seen in the fit result.
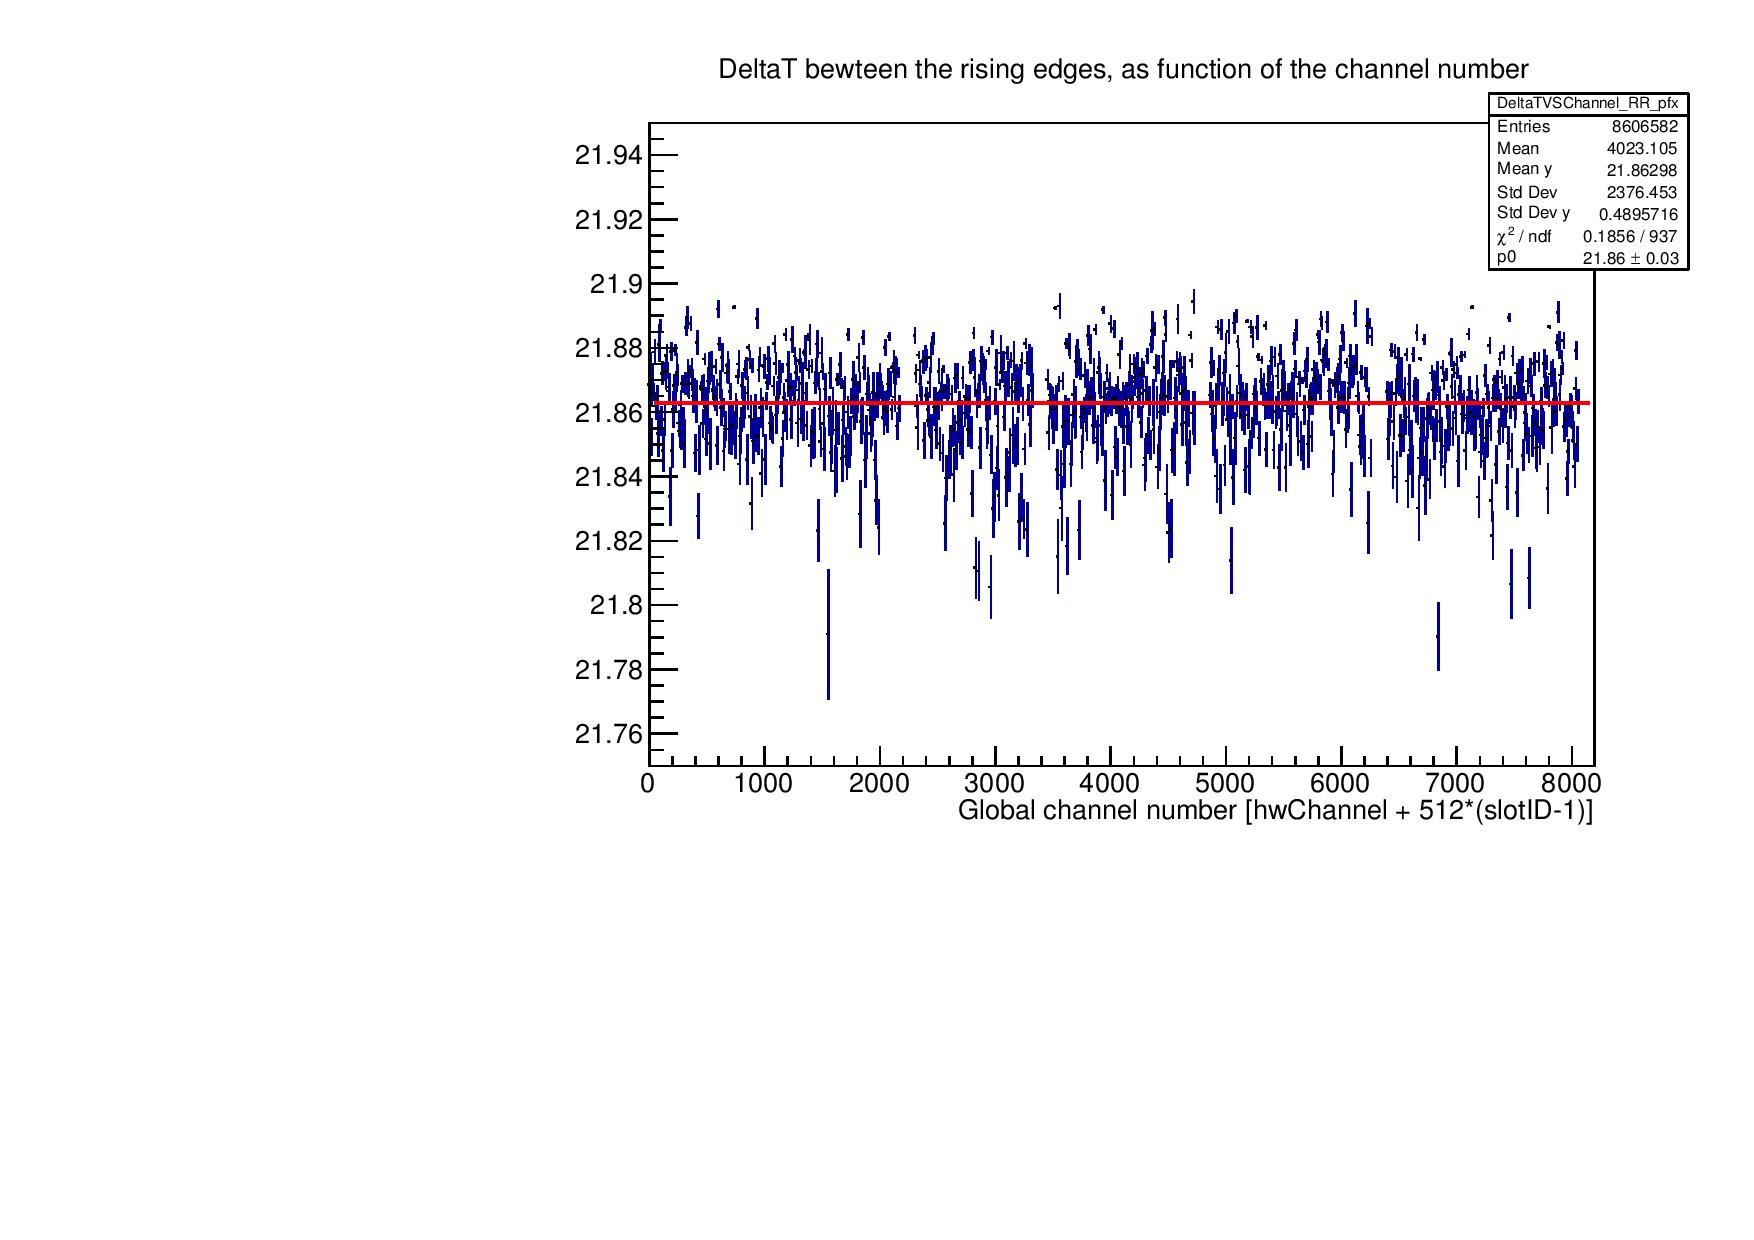
. the value of p0 is same as that of mean y but the chiSquare/ndf value is very low. I wonder if it is due to those zero bins. Is there a way I could improve the chiSquare/ndf value?