Fit multiple peaks with shared parameters

I have a spectrum, with 2 (or more) distant peaks. I want to fit all of them with a gaussian, where the sigma is constrained by a*energy + b, here a and b should be optimized simultaneously. And I want each of the peaks to have a separate constant background (i.e. a constant that is only nonzero in the vicinity of the peakregion).

For the moment, I use:

RooRealVar a_sig("a_sig","a of sigma relation", 0.00084, 0, 0.1,"keV");
RooRealVar b_sig("b_sig","b of sigma relation", 0.1, 0, 1,"keV");`

And then I make multiple ranges:

E.setRange(range_name.str().c_str(),downenergy, upenergy);

Then I make the background:

constback[ii] =  new RooRealVar(constback_name.str().c_str()," ",
                                15, 0, 1000,"keV");
constback_touse[ii] = 
   new RooFormulaVar(constback_touse_name.str().c_str(),
                     "(@0 > (@2-20))*(@0 < (@3+20)) *@1",
                     {*mx_const[ii],*constback[ii], *Roodown[ii], *Rooup[ii]});

where Rooup and down is just boundaries for the where I want the background.

And I define my model for each of the peaks as:

Sig[ii] =
new RooGenericPdf(sig_name.str().c_str(),
                  "(exp(-((@0 - @1)/(@2)) * ((@0 - @1)/@2)/2) /(@2*2.5) + @3)",
                  {E,*mx[ii],*sigma[ii], *constback_touse[ii]});
eSig[ii] = new RooExtendPdf(eSig_name.str().c_str()," ",*Sig[ii],*nSig[ii]);

Then the fit is performed as:

RooArgList pdfList{"pdfList"};
for(int i = 0; i < numPeaks; i++) {      
   pdfList.add(*(eSig[i]));     
}
RooAddPdf finalPDF("finalPDF","finalPDF",pdfList);
RooNLLVar nll("nll", "nll", finalPDF, data,
              Range(all_ranges.str().c_str()), Extended(kTRUE), NumCPU(100));
RooMinimizer m(nll) ;
m.migrad() ;
m.hesse() ;
RooFitResult* r_sig = m.save() ;

I have 3 problems, the first one is, that when I use:

finalPDF.plotOn(frame, RooFit::NormRange(all_ranges.str().c_str()));

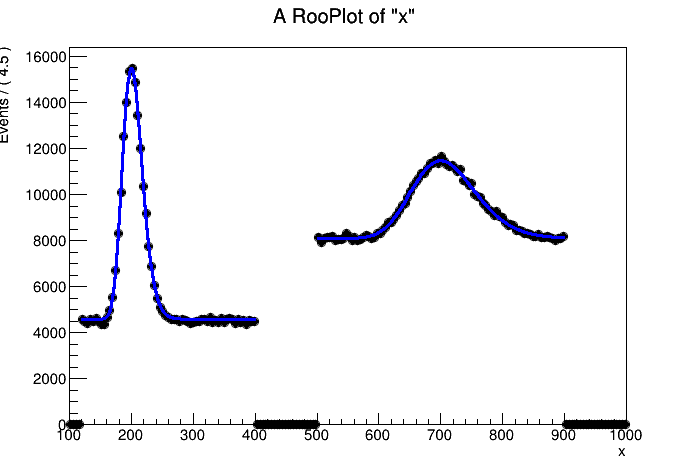
the background is clearly not used the way I want, I would expect a jump at Rooup[ii] +20, with Rooup = 855, but the background is just straight.

Moreover, I noticed that, the larger I make the interval for E (i.e. increasing the 1185 or decreasing the 830 in this definition: RooRealVar E("E","Energy1",830, 1185,"keV");), the worse the fit becomes. Even if I only fit one peak, it looks like less datapoints are taken into account?

Lastly, making this fit is taking >30min, while if I do not add the clipping, it is done in about a minute, which is rather weird to me.

Hello,

Can you please post your full macro and the data to reproduce the problem?

Lorenzo

Hi @MarieD,

while a full reproducer would be nice, I have some idea how to approach this based on the RooParametricStepFunc. Your approach doesn’t work for several reasons, which is why it was simpler in this answer to just create an example from scratch that you can adopt if you want.

Here is a code example:

using namespace RooFit;

// Define some constant parameters
const double xMin = 100.0;
const double xMax = 1000.0;
const std::size_t nEvents = 1000000;

// Fill the bin boundaries. Some bins I used for the gaps between the fit
// regions.
std::vector<double> binBoundaries{120, 400, 500, 900};

// The RooParametricStepFunction needs a TArrayD
TArrayD binBoundariesTArr{int(binBoundaries.size()),
                          binBoundaries.data()};

// The observable with the ranges around the peak
RooRealVar x{"x", "x", xMin, xMax};
x.setBins(200);
x.setRange("r1", 120, 400);
x.setRange("r2", 500, 900);

// Total number of background
RooRealVar nbkg{"nbkg", "bkg", 1000000, 0, 1e9};

// resolution parameters
RooRealVar a{"a", "a", 0.07, 0.01, 1.0};
RooRealVar b{"b", "b", 2, 0.0, 10.0};
RooFormulaVar res{"res", "a * x + b", {a, x, b}};

// Build the model
RooRealVar mu1{"mu1", "mu1", 200, 100, 1000};
RooRealVar mu2{"mu2", "mu2", 700, 100, 1000};
RooGaussian sig1{"sig1", "sig1", x, mu1, res};
RooGaussian sig2{"sig2", "sig2", x, mu2, res};

// Since the sigma is correlated with the observable,
// there is not simple analytical integral of the
// Gaussian anymore. Because of a bug, RooFit doesn't
// notice it itself, so we need to force the numeric
// integration of the Gaussians.
sig1.forceNumInt(true);
sig2.forceNumInt(true);

RooRealVar nsig1{"nsig1", "nsig1", 100000, 0, 1e9};
RooRealVar nsig2{"nsig2", "nsig2", 100000, 0, 1e9};

// Scaling coeff for the RooParametricStepFunction
RooRealVar bkg1{"bkg1", "bkg1", 0.001, 0, 20};
// The second bin in the step function is a gap,
// so constant zero.
// We only need n - 1 coefficients, because the final
// one is determined by the noamlization condition.
RooArgList coefList{bkg1, RooConst(0.0)};
RooParametricStepFunction bkg("bkg",
                              "bkg",
                              x,
                              coefList,
                              binBoundariesTArr,
                              binBoundaries.size() - 1);

RooAddPdf model{
    "model", "model", {sig1, sig2, bkg}, {nsig1, nsig2, nbkg}};

std::unique_ptr<RooAbsData> data{model.generateBinned(x)};

std::unique_ptr<RooFitResult> result{
    model.fitTo(*data, PrintLevel(-1), Save(), Range("r1,r2"))};

result->Print();

auto c1 = new TCanvas();

RooPlot *xframe = x.frame();
data->plotOn(xframe);
model.plotOn(xframe);
xframe->Draw();

c1->SaveAs("plot.png");

I know it’s quite complicated, so if you have any follow up questions, feel free!

The output plot looks like this:

And about your question with the fitting time: don’t use NumCPU(100). The overhead of communicating between all the processes will be very high and the fit will be very slow. Use 4 or 8 cores at a maximum, and even then it is not certain that it will be faster than without the NumCPU() option, so you should also try that.

Another way to speed things up is to avoid the Range() option, because this makes things quite slow because many normalization integrals need to be figured out by RooFit. You would also just fit the full range, and prepare your dataset and pdfs maybe in a way that they are always zero in the “gaps”.

I hope these ideas help you further!

Cheers,
Jonas

Dear @jonas , thanks a lot for the help, I really appreciate it.
However, I am a bit confused how this code allows for two different backgrounds, i.e in the range [120,400] the background is ~4600, while in [500, 900], the background is ~8000. However, for the background, there is only bkg1 and nbkg as parameters, so I do not see how these different backgrounds are generated and what the corresponding parameters are.
In other words, why has coefList only 2 elements and not 3 or 4, namely {bkg1,0,bkg2,0}?

Thanks in advance,
Cheers Marie

Hi @MarieD,

that’s a good question, I didn’t go into much detail in the original answer because I didn’t know if you actually care about the background parameters and uncertainties. So you want to know the number of background +/- uncertainty in each of these regions?

The reason why in my setup the RooParametricStepFunction has only two parameters is the following:
it’s bin boundaries are defined excluding the empty regions on the left and the right, so we have 3 bins in my example: the first peak, the “gap”, and the second peak. The RooParametricStepFunction is implementing a RooAbsPdf, so it normalizes itself. Because of this normalization condition, you only need 2 coefficients to fully define it for 3 bins.

Then, this RooParametricStepFunction is used in a RooAddPdf, where each component needs a coefficient that corresponds to a number of events, such that the total number of events can be used in an extended fit. So the nbkg parameter is the easiest to interpret: it’s the total number of background events. The coefficients of the step function are a bit more complicated to interpret, because they aren’t number of events but probability densities. To get the total number of events, you would have to multiply them by the range width and then by the total number of events. So for example, in the first region the number of background events in the example is bkg1 * (400 - 120) * nbkg. The number of events in the last region is just nbkg minus the number of events in all the other regions.

Does that make things a little bit more clear?

Dear @jonas , it does, thanks a lot for the help!

Dear @jonas , would this code also work for a non constant background, e.g. a linear background? Could I just redefine bkg1 as a RooFormulaVar? because then, for the background of the second peak, it would just be a constant if I understand well?

Yes, you can also use other pdfs for the background, but not a RooFormulaVar because it it not a pdf. You’d have to use a RooGenericPdf, which is the pdf equivalent of a RooFormulaVar. Maybe that’s better than my approach with the step function, because it’s more flexible.

Do I then add this RooGenericPdf to the coefList?

Nono, the RooGenericPdf would replace the RooParametricStepFunction in the RooAddPdf. The coefList would cease to exist as such, and instead you’d have a list of variables that get used in the formula of your RooGenericPdf. You can find examples here:

https://root.cern.ch/doc/master/rf103__interprfuncs_8C.html

But how does it force it to be zero then, outside the range?

Well, the formula in your RooGenericPdf will have some more complicated logic. You can do conditionals with the C++ ternary operator inline in the formula.

But maybe it’s better to write your background shape as a C++ function, declare this to ROOT and then use it in the RooGenericPdf. That’s what I would do, and I recently wrote about this approach here:

ok, thanks a lot for all of the help!

This topic was automatically closed 14 days after the last reply. New replies are no longer allowed.