I fit a function to a TGraph, before I have a pad. Eventually, when I draw the graph, I set Logx on the pad.
If I do the obvious (at least to me, greatly simplified, see attachment for working example):
g->Fit(f1, "R");
// Make a canvas and draw
new TCanvas();
gPad->SetLogx();
g->Draw("AP");
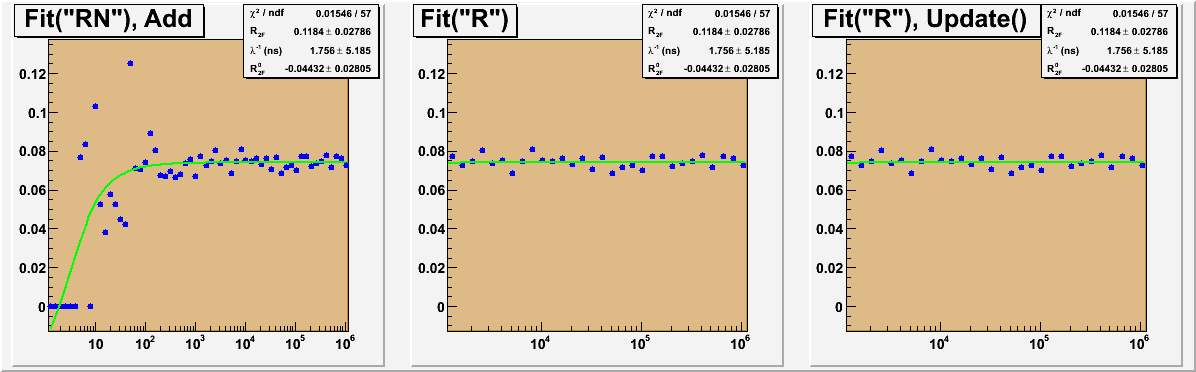
This produces the middle plot in the attached figure.
The axis range is incorrect (only three decades, not 6). (I need the “R” option because my function is ill-behaved at 0, so I’ve set the range appropriately.)
Thinking the fit is caching the underlying histogram, I tried:
g->Fit(f1, "R");
g->GetFunction(f1->GetName())->Update();
// Make a canvas and draw...
(Update() deletes the histogram.) I get the same (bad) behavior (right plot).
The only recipe I’ve come up with which produces the correct plot (on the left) is
g->Fit(f1, "RN");                  // don't attach fit to graph
g->GetListOfFunctions()->Add(f1);  // add it by hand
// Make a canvas and draw...
Is this a bug? Am I doing something outré?
Complete example macro, data file, and png of canvas are attached.
The way to bypass the problem is to set the log scale before doing the fit:
//______________________________________________________________________________
TGraphErrors *
DrawFitBug (const char * dataf = "DrawFitBug.data.txt")
{
  // Illustrate odd behavour of fits when drawing w/ or w/o Logx

  TCanvas *c1 = new TCanvas("DrawFitBug", "DrawFitBug", 1200, 400);
  c1->Divide(3,1);

  TGraphErrors *g1 = ReadGraphData(dataf);

  // my eyes must be going bad
  g1->SetMarkerStyle(kFullCircle);
  g1->SetMarkerSize(0.7);
  g1->SetMarkerColor(kBlue);
  g1->SetLineColor(kBlue);

  // make sure we ask for fit statistics, to see that we can get them
  gStyle->SetOptFit(1);     // default: Chisquare/DoF, parameter names, values,>
  gStyle->SetOptTitle();

  //  Create the graphs and fit them ___
  //  *before* we have a canvas/pad

  //  Correct plot:
  TF1 *f1 = NewFitFunction("Fit(\"RN\"), Add");
  g1->SetTitle(f1->GetName());
  c1->cd(1);

  gPad->SetLogx();
  g1->Fit(f1, "R");
  g1->Draw("AP");

  //  Obvious, but incorrect plot
  TF1 *f2 = NewFitFunction("Fit(\"R\")");
  TGraphErrors *g2 = new TGraphErrors(*g1);
  g2->SetTitle(f2->GetName());
  g2->Fit(f2, "R");  // do the fit, attaching to graph

  //  Should fix the error, but doesn't
  TF1 *f3 = NewFitFunction("Fit(\"R\"), Update()");
  TGraphErrors *g3 = new TGraphErrors(*g1);
  g3->SetTitle(f3->GetName());
  g3->Fit(f3, "R");  // do the fit, attaching to graph
  g3->GetFunction(f3->GetName())->Update();


  // Now we make a pad and draw ________
  c1->cd(2);  gPad->SetLogx();  g2->Draw("AP");
  c1->cd(3);  gPad->SetLogx();  g3->Draw("AP");

  return g1;
}
I’ll try that out, but I think it will create other problems, in my case:
[ul][li] There may not be a canvas/pad yet. I thought gPad was null in this case?[/li]
[li] The current pad may not be mine. I can be called to do a fit in order to get the fit parameters after some one else has created a canvas and drawn. I don’t want to change the log setting on their pad, just to do my fit.[/li][/ul]
This is clearly a bug in the graph painting function and it will be fixed by Olivier. What happens is the following:
g2->Fit draws the graph in linear scale. The best scale computed for the graph is [0,1e6]. When setting the logx scale, the already existing histogram with x axis starting at 0 is used. The graph painting routine finds 0 for the minimum and resets it to xmax/1000. It should set it to the decade such that the first graph point is included
Yes that’s what Lorenzo and I found out. That needs do be fixed (carefully to avoid side effects). I gave the workaround just to help temporarelly but my intention was to fix it.