Hello, I want to ask a question. I use RooFit to fit the histogram, and there are fitting curves and error bars. How can we get rid of the error bars and only keep the curves?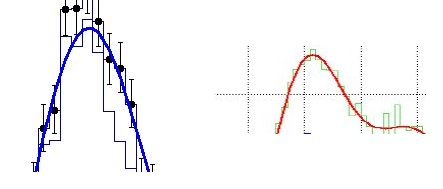 In other words, how to get to the right from the left? Thank you.
Dear zhaoqin,
On the left you have two histograms (one visualized as a line, one with markers and error bars) and a curve, presumably the result of a fit to the histogram with error bars.
On the right you have only one histogram and a curve.
I guess you have to start by removing the histogram that you do not want.
Then you have to play with the plotting options: see options at RooAbsData::plotOn and the tutorial rf107_plotstyles.C .
G Ganis
Thank you for your help! I have solved the problem successfully.
data.plotOn(xframe,DrawOption(“E0”),DataError(RooAbsData::None),XErrorSize(0)); This is my code.