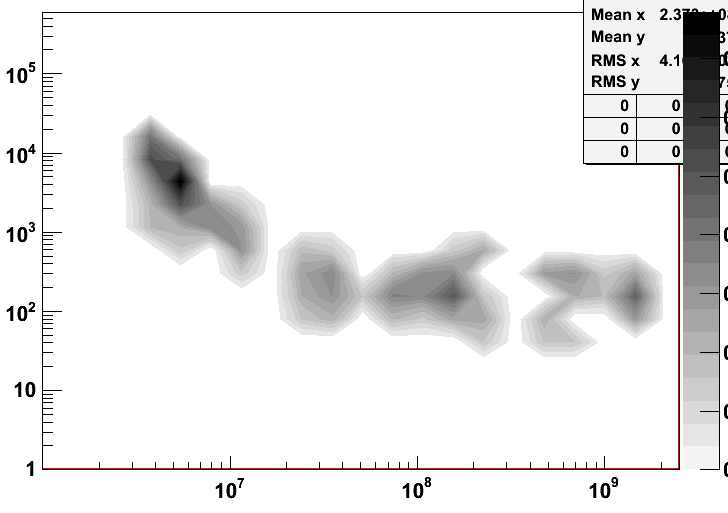
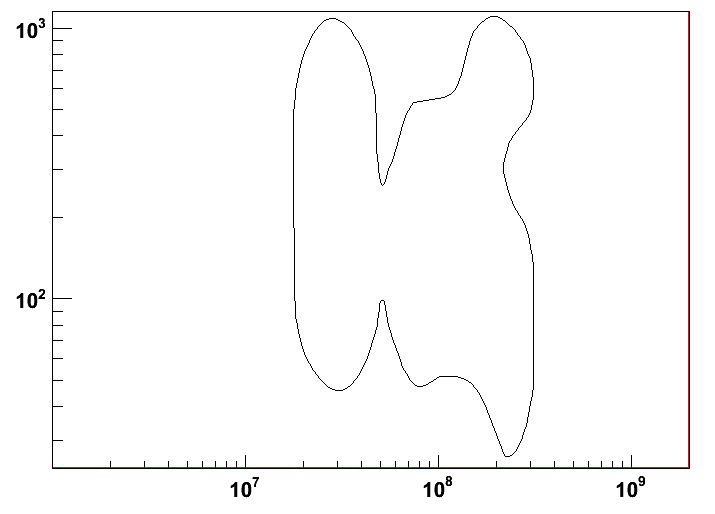
I am having trouble getting the first contour from the attached plots- my code is directly taken from the tutorial page and I input the TH2F histogram which is plotted as a contz below. The output of the first contour algorithm is only returning that of the centre region of the histogram and I am unclear why. Could someone please assist? The relevant bit of code from where the histogram was filled to the output of the first contour is below.
Thanks so much
Darren
  TH2F *sfr_prob_68 = new TH2F("sfr_prob_68","sfr_prob_68",xnbins,xbins,ynbins,ybins);

  agehere = 0.;
  sfrhere = 0.;
  probhere = 0.;
  int real_pos;
  poscounter = 0;
  for (i = 0; i<point_68; i++) {
    real_pos = position_holder[i];
    agehere = (age_holder[real_pos]);
    sfrhere = (sfr_holder[real_pos]);
    probhere = prob_holder[i];
    summer = summer + probhere;
    //cout << " real_pos is: " << real_pos << " probhere is: " << probhere << endl;
    sfr_prob_68->Fill(agehere,sfrhere,probhere);
    poscounter++;
  }

  //  sfr_prob_68->SetContour(2);
  //sfr_prob_68->SetContourLevel(0,0.01);
  //sfr_prob_68->Smooth(1,"k3a");
  c1->cd();
  sfr_prob_68->Draw("contz,list");
  c1->Update();

  TCanvas *c2 = new TCanvas("c2","First contour",100,100,800,600);
  TObjArray *contours = (TObjArray*)gROOT->GetListOfSpecials()->FindObject("contours");
  if (!contours){
    cout << "entered here" << endl;
    return;
  }
  TList *lcontour1 = (TList*)contours->At(0);
  if (!lcontour1) return;
  TGraph *gcl1 = (TGraph*)lcontour1->First();
  if (!gcl1) return;
  if (gcl1->GetN() < 10) return;

  TList *lcontour2 = (TList*)contours->At(1);
  if (!lcontour2) return;
  TGraph *gcl2 = (TGraph*)lcontour2->First();
  if (!gcl2) return;
  if (gcl2->GetN() < 10) return;


  //gcl->SetMarkerStyle(21);
  //gcl->Draw("ac");
  int num_points = gcl1->GetN();
  Double_t tg_68_x[num_points];
  Double_t tg_68_y[num_points];
  float graph_68_x[num_points];
  float graph_68_y[num_points];
  for (i=0;i<num_points;i++){
    gcl1->GetPoint(i,tg_68_x[i],tg_68_y[i]);
    graph_68_x[i] = TMath::Power(10,tg_68_x[i]);
    graph_68_y[i] = TMath::Power(10,tg_68_y[i]);
  }
TGraph *graph_68 = new TGraph(num_points,graph_68_x,graph_68_y);
Can you please send a running example. With your code I get:
root [0]
Processing firstcont.C...
Error: Symbol xnbins is not defined in current scope  firstcont.C:1:
Error: Symbol xbins is not defined in current scope  firstcont.C:1:
Error: Symbol ynbins is not defined in current scope  firstcont.C:1:
Error: Symbol ybins is not defined in current scope  firstcont.C:1:
*** Interpreter error recovered ***
I downloaded your files. I executed your macro. I get the contour in gray, scale but the canvas supposed to show the first contour is empty. Is it normal ? Can you check the files you sent me ? I am running on Linux with the last ROOT version.
Also your macro gives me the following message:
It was missed in the copying of the macro- sorry about that. You will see it only selects the middle “island” contour and misses the others. Is there a way to get all of the first contours- ie those of the outer most level for all islands?
Because each “Island” is a contour even if they are on the same altitude. Anyway way a TGraph can be only one curve not several. Have a look at the following example to see how to proceed.
why/how did you select the 500,700, and 900 for the contour values here? I assume I need to do something similar to select my 2 or 3 islands? Also, I will need a TGraph for each contour that is extracted?
Best wishes
Darren
What is interesting for you is the last loop. TotalConts is the total number of contours. The internal loop gets all the graphs belonging to this particular contour.
I put the loop example into the end of the macro we have been testing. There seems to be something wrong- none of the contours that should be extracted as TGraphs are being drawn onto the TH2F colz plot . I have also tried to draw them to their own canvas an the canvas always appears blank. Can you please advise? The new macro is below.