Dear Experts,
I am plotting scatter plot between two variables(costhetaK and costhetaL). I am attaching the plot. Could you please tell me how can I know that there is correlation between these two variables or not?
Thanks,
Deepak
Dear Experts,
I am plotting scatter plot between two variables(costhetaK and costhetaL). I am attaching the plot. Could you please tell me how can I know that there is correlation between these two variables or not?
Thanks,
Deepak
It is a plot you obtained with TTree::Draw() or with TH2::Draw() ?
Hi Couet,
I got from TTree::Draw().
Thanks,
Deepak
So if you do something tree->Draw("x;y") the points you see are drawn at each (x,y) values present in the tree. After this command the “htemp” 2D histogram, is available (you can also fill a predefined histo with tree->Draw("x;y >> h")). On this histogram you may then use:
https://root.cern.ch/doc/master/classTH2.html#a278f760082567271396ae0b6a39fcd70
May be @moneta has more to say,
Hi Couet,
I want to know are they(two variables) correlated by looking at the plot?
Thanks,
Deepak
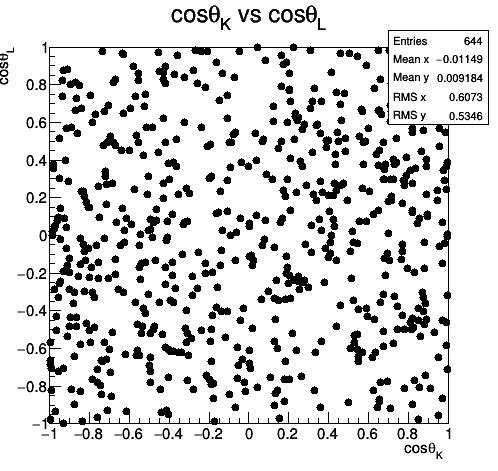
The plot looks quite random therefore I would say there is no obvious correlation just “looking at the plot”.
Hi,
From your plot the two variables seem unrelated, because they are uniformly distributed on the plane. If they are correlated the point will tend to accumulate, usually in an ellipsoid shape
Moreover the mean along x and y is close to 0 and the RMS along both axises is close to the one of a flat distribution between -1 and 1, despite your low statistic. So seem they aren’t correlated.
If you want a more quantitative answer you should look at the covariance between the 2 variables
You can get that from the temporary histogram using the method TH2::GetCovariance, if the value is close to 0 the variables are not correlated, if is close to 1(-1) the variable are correlated(anti-correlated).
Cheers
Stefano
Hi,
In case you don’t want to bin your data and directly get the correlation from the data, we have in ROOT also a class to estimate it. It is called TRobustEstimator, which has also the capability to compute the covariance/correlation matrix removing the outliers.
Lorenzo
Hi Stefano,
Thanks for your explanation. I want to calculate covariance between these variables(shown in the plot).Could you please tell me how to use method TH2::GetCovariance? I am attaching my macro. Please have a look at it.costheta_kl.cc (1.2 KB)
Thanks,
Deepak
Hi,
Just add this line at the end of the macro:
double covariance = h_kl.GetCovariance();
Lorenzo
Hi,
It is showing error as below.
Error: Invalid type ‘Double_t’ in declaration of ‘axis’ costheta_kl.cc:34:
Error: Invalid type ‘Double_t’ in declaration of ‘axis’ costheta_kl.cc:34:
*** Interpreter error recovered ***
Thanks,
Deepak
Remove the line in your macro
h_kl.GetCovariance(Double_t axis=1 , Double_t axis=2);
Functions are not called like this in C++, this is a declaration.
Add instead the line I have written before
Hi,
h_kl is a TH2D pointer so you have to do h_kl->GetCovariance();
Cheers
Stefano
Hi,
It’s working. Thanks.
Thanks,
Deepak