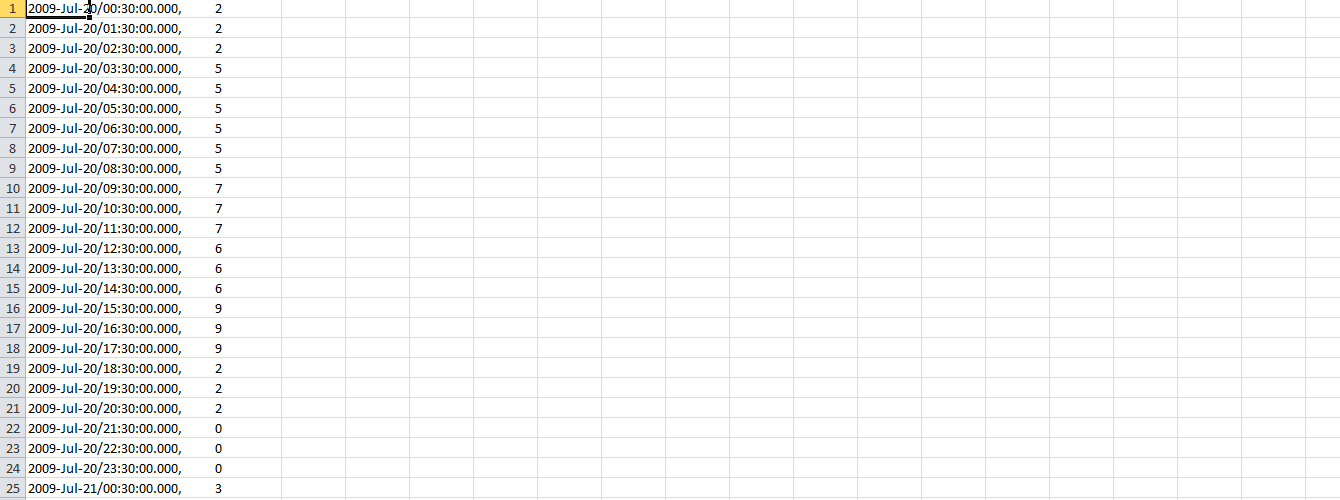
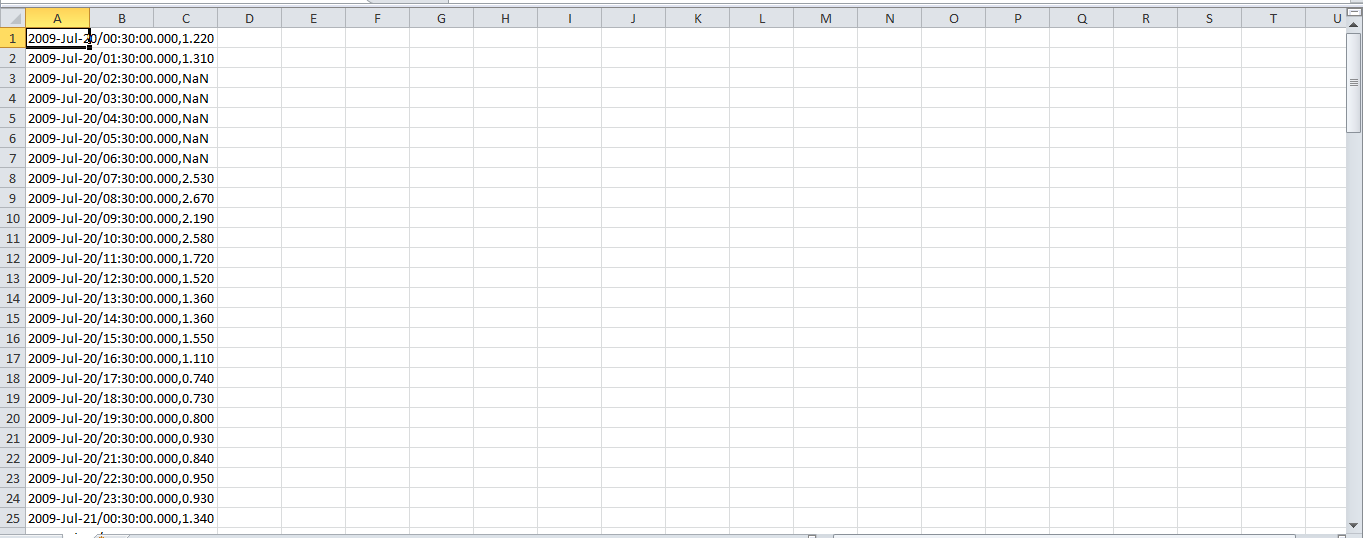
I want to draw graph according to time and then I want to find relationship between two graph
Which type of graph (histogram,canvas,line graph…) should I use? How can I find relationship between these graph(lineer,nonlinear ,exponential)
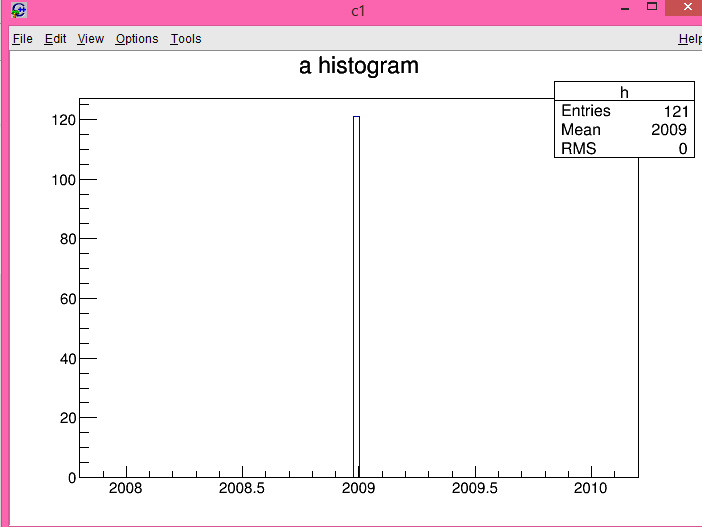
I tried draw Histogram But I could not get a good result
Hmm I have not a concrete example but I am trying explain Actually these data from nasa and it is about the storms in the sun I want to these
draw graphs firstly(But I could not draw graph you can see above the page my graph
and then finding minimum value in the second graph for the maximum value in the first graph or finding the exact opposite
Finally I want to fit a function for finding reletionship for these min and max value
For point 1) you should create a TGraph with the data points you have and draw it using the Draw method. Then you can write a small C++ doing what you explain in point 2) .