Hi ,
I am trying to fill the area between two TGraph objects. The SetFillColor option is not solving this problem. I also tried using the example for drawing exclusion region, but since this draws bands of fixed size this doesn’t help me.
-thanks Debdatta.
see example below:
Rene
void grshade() {
   TCanvas *c1 = new TCanvas("c1","A Simple Graph Example",200,10,700,500);

   c1->SetGrid();
   c1->DrawFrame(0,0,2.2,12);

   const Int_t n = 20;
   Double_t x[n], y[n],ymin[n], ymax[n];
   Int_t i;
   for (i=0;i<n;i++) {
     x[i] = 0.1+i*0.1;
     ymax[i] = 10*sin(x[i]+0.2);
     ymin[i] = 8*sin(x[i]+0.1);
     y[i] = 9*sin(x[i]+0.15);
   }
   TGraph *grmin = new TGraph(n,x,ymin);
   TGraph *grmax = new TGraph(n,x,ymax);
   TGraph *gr    = new TGraph(n,x,y);
   TGraph *grshade = new TGraph(2*n);
   for (i=0;i<n;i++) {
      grshade->SetPoint(i,x[i],ymax[i]);
      grshade->SetPoint(n+i,x[n-i-1],ymin[n-i-1]);
   }
   grshade->SetFillStyle(3013);
   grshade->SetFillColor(16);
   grshade->Draw("f");
   grmin->Draw("l");
   grmax->Draw("l");
   gr->SetLineWidth(4);
   gr->SetMarkerColor(4);
   gr->SetMarkerStyle(21);
   gr->Draw("CP");
}
Hello Rene,
thanks , this is what I was looking for.
Hi,
Is there anyway to set the transparency of the coloured area when it is “solid” filled?
I tried this two things (one is commented) but none works:
void grshade() {
   TCanvas *c1 = new TCanvas("c1","A Simple Graph Example",200,10,700,500);

   c1->SetGrid();
   c1->DrawFrame(0,0,2.2,12);

   const Int_t n = 20;
   Double_t x[n], y[n],ymin[n], ymax[n];
   Int_t i;
   for (i=0;i<n;i++) {
     x[i] = 0.1+i*0.1;
     ymax[i] = 10*sin(x[i]+0.2);
     ymin[i] = 8*sin(x[i]+0.1);
     y[i] = 9*sin(x[i]+0.15);
   }
   TGraph *grmin = new TGraph(n,x,ymin);
   TGraph *grmax = new TGraph(n,x,ymax);
   TGraph *gr    = new TGraph(n,x,y);
   TGraph *grshade = new TGraph(2*n);
   for (i=0;i<n;i++) {
      grshade->SetPoint(i,x[i],ymax[i]);
      grshade->SetPoint(n+i,x[n-i-1],ymin[n-i-1]);
   }
   //grshade->SetFillStyle(3013);
   /*
   TColor *col26 = gROOT->GetColor(26);
   col26->SetAlpha(0.2);
   grshade->SetFillColor(26);
   */
   grshade->SetFillColorAlpha(kRed, 0.2);
   grshade->Draw("f");
   grmin->Draw("l");
   grmax->Draw("l");
   gr->SetLineWidth(4);
   gr->SetMarkerColor(4);
   gr->SetMarkerStyle(21);
   gr->Draw("CP");
}
I always get an opaque color
See at the end of the transparency doc:
The transparency is available on all platforms when the flag OpenGL.CanvasPreferGL is set to 1 in $ROOTSYS/etc/system.rootrc , or on Mac with the Cocoa backend. On the file output it is visible with PDF, PNG, Gif, JPEG, SVG, TeX … but not PostScript.
I don’t really know if I did it right but still it doesn’t work. I edited the file D:\Debian\ROOT\etc\system.rootrc (where I installed ROOT) to have
# Flag to set CanvasPreferGL via gStyle
OpenGL.CanvasPreferGL:                      1
I run the code again (in a new console), but nothing changes.
I’m using Windows Subsystem for Linux (Debian):
ROOT 6.24/06
Built for linuxx8664gcc
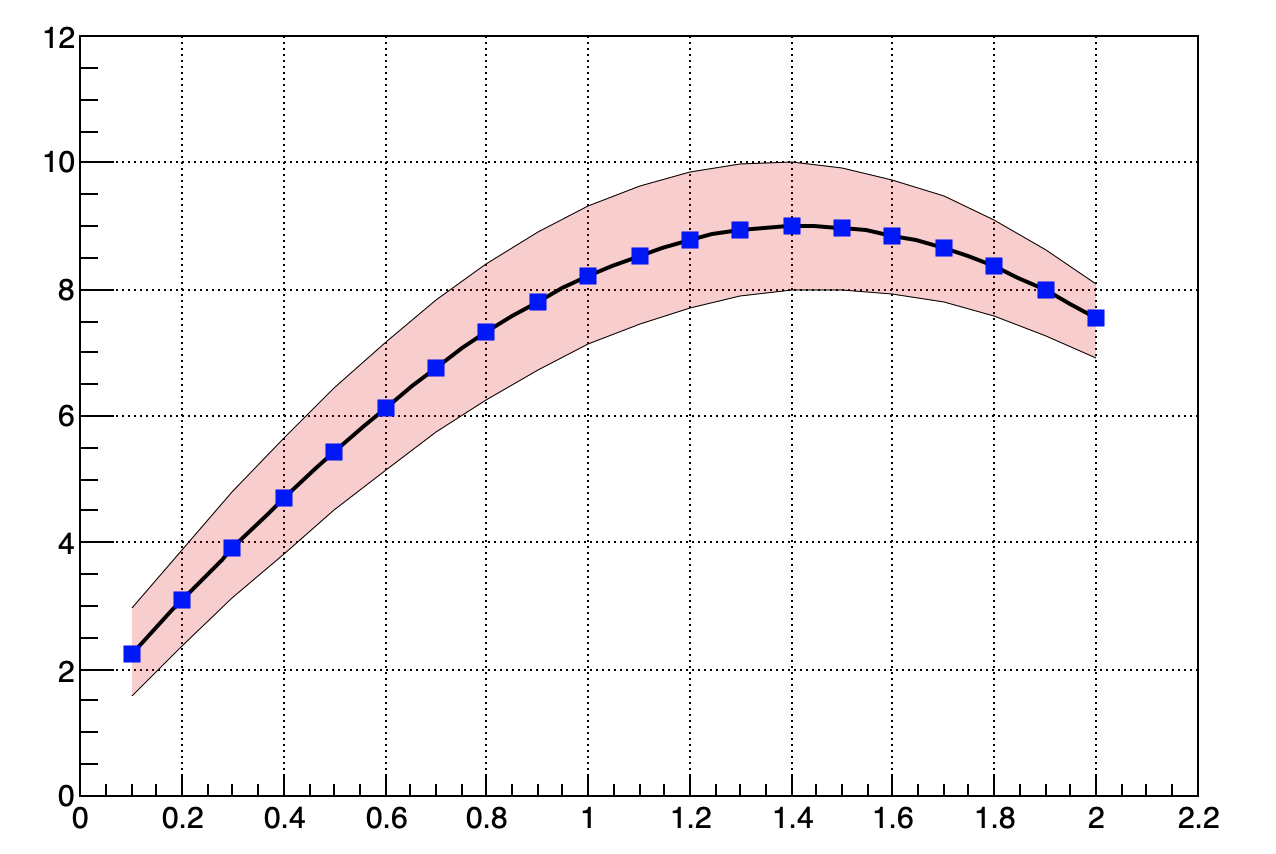
Yes it works on my Mac where transparency on-screen is supported:
void grshade() {
   TCanvas *c1 = new TCanvas("c1","A Simple Graph Example",200,10,700,500);

   c1->SetGrid();
   c1->DrawFrame(0,0,2.2,12);

   const Int_t n = 20;
   Double_t x[n], y[n],ymin[n], ymax[n];
   Int_t i;
   for (i=0;i<n;i++) {
     x[i] = 0.1+i*0.1;
     ymax[i] = 10*sin(x[i]+0.2);
     ymin[i] = 8*sin(x[i]+0.1);
     y[i] = 9*sin(x[i]+0.15);
   }
   TGraph *grmin = new TGraph(n,x,ymin);
   TGraph *grmax = new TGraph(n,x,ymax);
   TGraph *gr    = new TGraph(n,x,y);
   TGraph *grshade = new TGraph(2*n);
   for (i=0;i<n;i++) {
      grshade->SetPoint(i,x[i],ymax[i]);
      grshade->SetPoint(n+i,x[n-i-1],ymin[n-i-1]);
   }
   grshade->SetFillColorAlpha(kRed, 0.2);
   grshade->Draw("f");
   grmin->Draw("l");
   grmax->Draw("l");
   gr->SetLineWidth(4);
   gr->SetMarkerColor(4);
   gr->SetMarkerStyle(21);
   gr->Draw("CP");
}
try to add:
gStyle->SetCanvasPreferGL(true);
at the beginning of your macro.
With that extra line works, maybe I was editing the wrong file. Otherwise, I prefer this solution since I don’t need to edit any file that I don’t known.