ROOT Version: 6.16/00
Platform: Ubuntu 20.04
Compiler: gcc version 9.4.0 (Ubuntu 9.4.0-1ubuntu1~20.04.2)
Dear co-rooters,
I am trying to perform a FFT on a simple sinusodial function, copying the example FFT.C.
I am creating a TF1 object and then a TH1D histogram that samples from that function. Here’s how it looks
This function has a period of 2Pi seconds (assume it’s a signal) and therefore a frequency of 1/2Pi=0.16 Hz. If I do a Fourier transform, I would expect a peak at 0.16 Hz.
I understand that TH1::FFT won’t give me the actual frequency and I will need to scale the x-axis. The unscaled FFT looks like this:
There’s a peak at 0 (no idea why) and a peak around 250 which I think corresponds to the number of bins of my input histogram. If I change the number of bins to 25, then the peak appears at 25. So the units are bins or indices. If that’s correct, I would expect the frequency to be ta 1/125, since one period is completed at bin# 125 (there are 2 periods or cycles over the range of the input histogram).
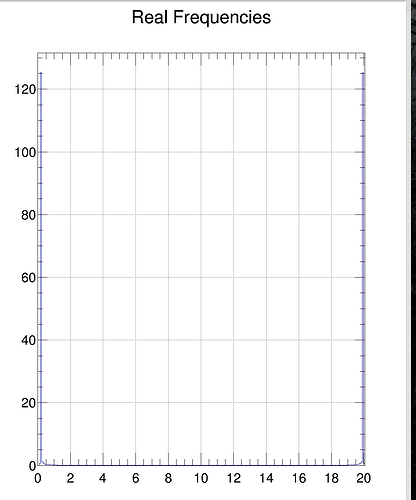
I (think) I’m properly rescaling the x-axis, but I get the following:
Instead of a peak at 0.16, I get a peak at 20 and a peak at 0.2.
What am I doing wrong?
Here’s my code
#include "TF1.h"
#include "TH1D.h"
#include "TMath.h"
#include "TVirtualFFT.h"

void FFT() {

   // Define sin(x) function
   TF1 *fsin = new TF1("fsin", "sin(x)", 0, 4*TMath::Pi());
   fsin->Draw();

   // Define histogram and fill with sin(x) values
   int n = 250;  // number of bins
   TH1D *hsin = new TH1D("hsin", "hsin", n+1, 0, 4*TMath::Pi());

   // Fill the histogram with function values
    double x;
   for (int i=0; i<n; ++i) {
      x = (Double_t(i)/n)*(4*TMath::Pi());
      hsin->SetBinContent(i+1, fsin->Eval(x));
   }
   hsin->Draw("same");

   // Compute the Fourier transform and look at the magnitude of the output
   TH1 *hm = nullptr;
   TVirtualFFT::SetTransform(nullptr);
   hm = hsin->FFT(hm, "MAG");
   hm->SetTitle("Magnitude of the Fourier Transform");
   //hm->Scale(1./sqrt(n));  // Rescale by sqrt(n)

   // Now we need to rescale the x-axis to show real frequencies
   double low_end_sin   = hsin->GetBinLowEdge(1);
   double upper_end_sin = hsin->GetBinCenter(n)+hsin->GetBinWidth(n)/2.;
   double range_sin     = upper_end_sin - low_end_sin;

   int bins_FFT         = hm->GetNbinsX();
   double low_end_FFT   = hm->GetBinLowEdge(1)/range_sin;
   double upper_end_FFT = ( hm->GetBinCenter(bins_FFT)+hm->GetBinWidth(bins_FFT)/2. )/range_sin;

   TH1D *h_FFT = new TH1D("h_FFT", "Real Frequencies", bins_FFT, low_end_FFT, upper_end_FFT);

   // Set the new x-axis (real frequencies) and fill the histogram with magnitudes
   for (int i=0; i <bins_FFT; ++i) {
   		h_FFT->SetBinContent(i+1, hm->GetBinContent(i+1));
   }

   hm->Draw("histo");
   h_FFT->Draw("histo");
}
Any help will be much appreciated!


