Extremal edges of histograms drawn incorrectly

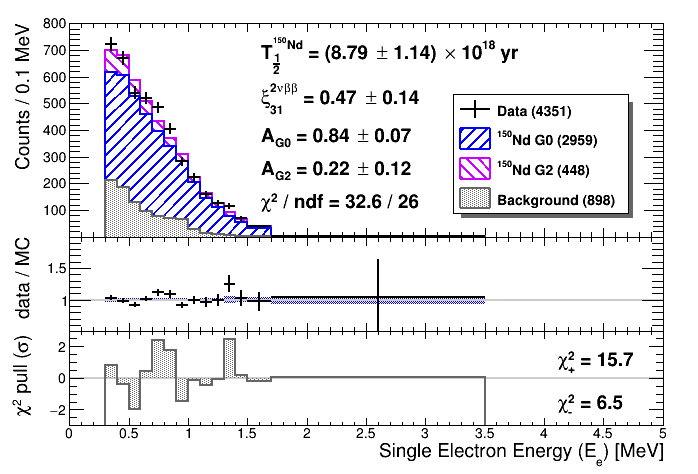
Below is an image produced by a drawing macro. The bottom pad histogram appears to be drawn incorrectly.

This histogram has uniform bin widths except for the two highest energy bins, which are larger.

The axis are created using TH1F *hr1 = pad->DrawFrame(0.0, -3.0, 5.0, 3.0);.

A TLine object is then drawn followed by a histogram with the option "histsame".

I don’t know why ROOT would draw the two ends of the histogram with these vertical lines. I don’t know where they go to, but I assume it is -infinity.

I tried drawing with the option ][histsame. But that looked strange because the edges were missing.

Is there some kind of workaround?

I’ve not noticed this before, but I only recently changed my code to use non-uniform binning. Previously the histogram was defined with bins over the full x-axis range: 0.0 to 5.0. Now it is defined fom 0.3 to 3.5.

I would assume this has nothing to do with the over/underflow bins since these should contain zero.

Here is a list of corresponding bin content values.

PULL i=1 content=0.817964
PULL i=2 content=-0.363984
PULL i=3 content=-1.97934
PULL i=4 content=0.41355
PULL i=5 content=2.40882
PULL i=6 content=1.74799
PULL i=7 content=-1.49012
PULL i=8 content=-0.140457
PULL i=9 content=-0.466029
PULL i=10 content=-0.0590581
PULL i=11 content=2.44735
PULL i=12 content=0.19361
PULL i=13 content=-0.175366
PULL i=14 content=0.0592941


Please read tips for efficient and successful posting and posting code

ROOT Version: Not Provided
Platform: Not Provided
Compiler: Not Provided


Just guessing, but maybe this helps gStyle->SetHistMinimumZero();

It looks like you histogram has negative bin contents.
@dastudillo suggestion may work.
Can you post your histogram here ?

This does not appear to have made any difference graphically.

I have these lines right at the start of main().

image

What format would you like me to post the histogram in?

Should I upload a TFile somehow?

Yes the .root file

Please enjoy this histogram

pull.root (3.8 KB)

Try:

gPad->DrawFrame(0.0, -3.0, 5.0, 3.0);
h_pull_P1_tmp->SetLineColor(0)
h_pull_P1_tmp->Draw("same")

Hi I’m confused by your suggestion. Here is what that produces…

image

Here’s the code used to draw the bottom pad

TH1F *hr2 = pad2_px->DrawFrame(0.0, PAD_L_Y_MIN, 5.0, PAD_L_Y_MAX);

hr2->GetXaxis()->SetTickSize(0.06);
hr2->GetXaxis()->SetLabelSize(15);
hr2->GetXaxis()->SetLabelFont(43);
hr2->GetXaxis()->SetTitleSize(20);
hr2->GetXaxis()->SetTitleFont(43);
hr2->GetXaxis()->SetTitleOffset(3.0);
hr2->GetXaxis()->SetTitle("Single Electron Energy (E_{e}) [MeV]");
hr2->GetYaxis()->SetTickSize(0);
hr2->GetYaxis()->SetLabelSize(0);
hr2->GetYaxis()->SetTitleSize(20);
hr2->GetYaxis()->SetTitleFont(43);
hr2->GetYaxis()->SetTitleOffset(1.0);
hr2->GetYaxis()->SetTitle("#chi^{2} pull (#sigma) ");
h_pull_px_tmp->SetLineColor(0);
h_pull_px_tmp->Draw("same");
TLine *linezero3 = new TLine(0.0, 0.0, 5.0, 0.0);
linezero3->SetLineWidth(2);
linezero3->SetLineColor(kGray);
linezero3->Draw();
h_pull_px_tmp->Draw("histsame");

I guess I just didn’t quite understand the suggestion?

The idea is to not draw the line around the histogram.

Ok fine.

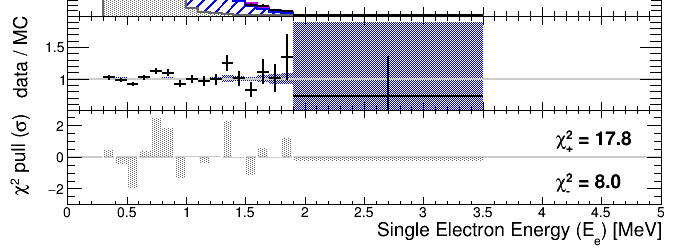
The workaround I am using is to add an additional bin either side which extends to the axis limit. This may require an update to other analysis code to ignore the two empty bins at either extreme.

Not drawing the line might be simpler as you do not need to change the histogram.
May be this would need to create an GitHub issue .

@couet but why do we draw a line towards -inf here, in case these bins are empty? Or are they not empty? What’s the bin content of the X^2 pull hist at bin 3.5…5?

It should get fixed.

After talking to Olivier I understand it’ll get fixed :slight_smile:

I made an issue:

Thanks for reporting.

A PR is on the way in order to fix this issue.

The PR is now merged.

This topic was automatically closed 14 days after the last reply. New replies are no longer allowed.