Dear all,
I’m trying to put a gaussian constrain on the extension variable of an extended likelihood. I started from rf604_constraints.C and I’m attaching my implementation. For some reason that is not clear to me, it doesn’t work… Can someone help on that?
Thanks!
rf604_constraints.C (2.3 KB)
@StephanH perhaps you can help?
Hi @Stefanos21,
what makes you think it does not work? Or to phrase it differently:
I haven’t understood yet what the problem is.
EDIT:
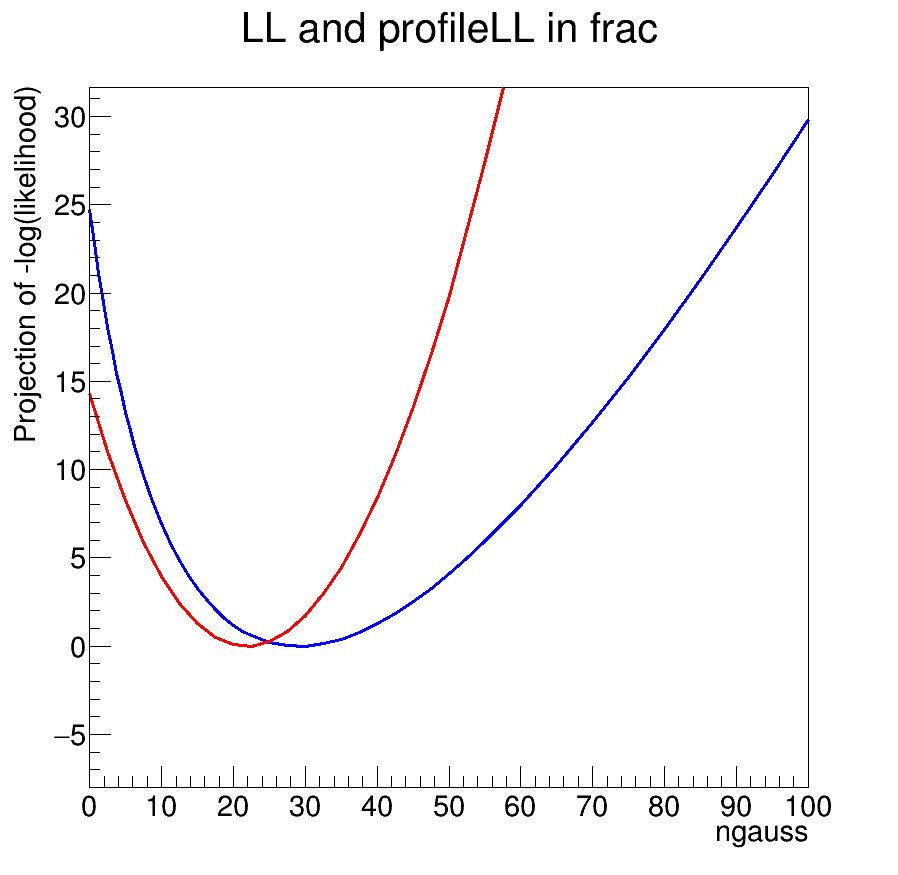
Ok, I got it. Your constraint, in fact, works fine, but it’s brutal. It’s so brutal that the PDF is always zero. That’s because the sigma is 0.01. With
RooGaussian fconstraint("fconstraint","fconstraint",ngauss,RooConst(25.),RooConst(5.)) ;
the constraint is much less brutal, and you get reasonable fit results and also an NLL plot.
PS:
Use a smaller frame to get a nicer plot:
RooPlot* frame1 = ngauss.frame(Bins(10),Range(0., 100), Title("LL and profileLL in frac")) ;
Hey Stephan! Thanks a lot!
But, now I’m a bit more puzzled… Shouldn’t the blue and red minimum be the same?? Indeed this is what I see on the terminal as fit result, but not on the plot…
Thanks again!
Well, I set the target of this constraint to 20 or so, so the minimum will move in the direction of what the constraint tells it to.
EDIT
Oh, there are two more problems.
- You are creating two frames that have different y axes. You have to delete
frame2 entirely, and only plot on frame1.
- I would advise to use the RooAddPdf in extend mode instead of extending manually. That makes a difference when different ranges are entering the game (here, it’s presumably the fit range from 0 to 200, but the plot range from 0, 100).
Here’s the updated extension:
  RooRealVar ngauss ("ngauss", "ngauss", 100, 0, 100);
  RooRealVar npoly  ("npoly",  "npoly", 100, 0, 200);

  RooAddPdf model("model","model", RooArgSet(gauss,poly), RooArgSet(ngauss,npoly));
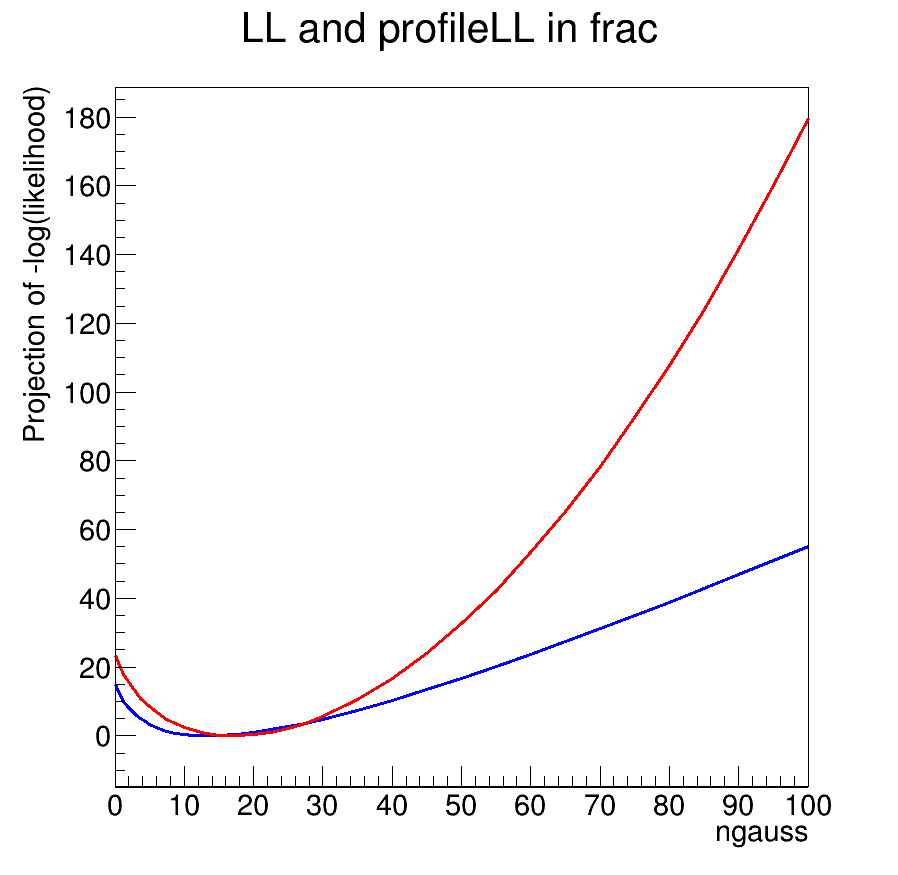
Here it looks much more like what you expect, namely
- The red curve has a sharper minimum.
- The minimum is around 20, as I set it.
Thanks a lot for the followup!
Just for clarification… The constrain has a mean, fixed on the yield. The yield returns a value X from the fit, but the minimum won’t be that X in the display? I was expecting to see a difference on how wide the likelihood would be… Not the central value…
Thanks again!!
If you add a constraint, that sort of means for the likelihood: "Measure the value of the yield in data, but take into account that it should be around the central value (X ± sigma) at 68% CL. Depending on how large sigma is, the result will be in between the value that is favoured by the data and the mean of the constraint term. Stronger constraints pull it closer to the mean of the constraint term. In my case, where I set it to 20±5, you see that it’s going much closer to 20 than in the fit to data, which seems to favour something like 15. Of course, you also see that with constraint terms the profiles get narrower.
I would suggest one modification to your likelihood model:
When you directly constrain to a yield, the mean value of the constraint needs to depend on the number of data events. If you would use a signal fraction instead, you can use the constraint independently of the amount of data.