Hi All,
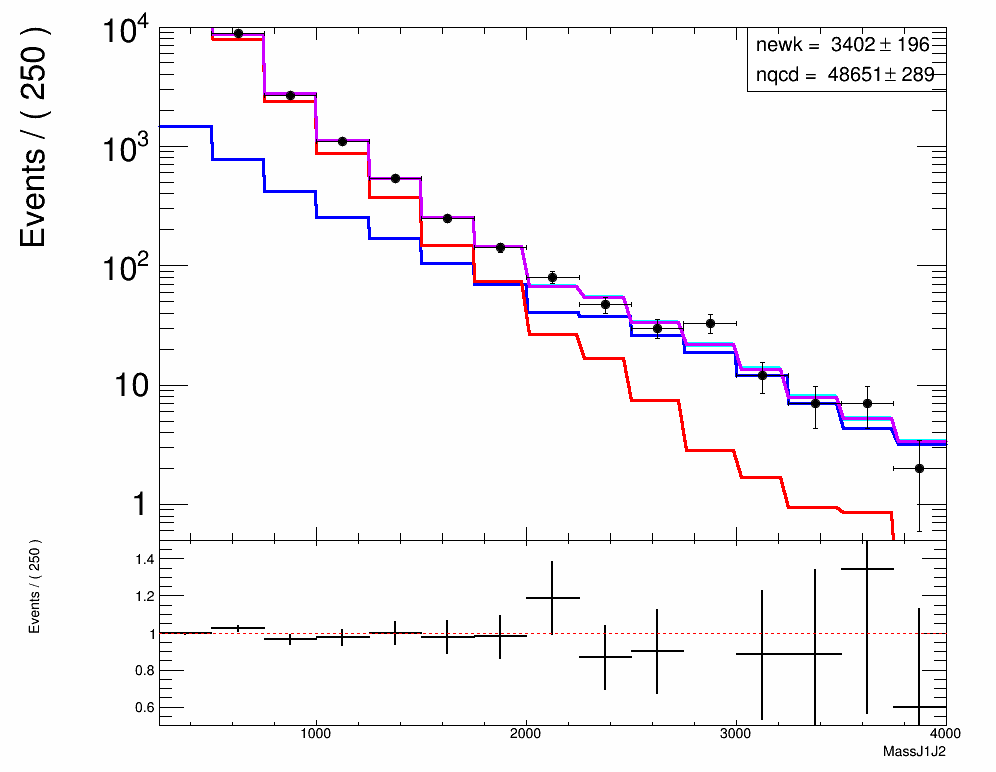
I am trying to do an extended binned maximum likelihood fit in order to extract the relative number of signal and background events in data. I seem to have a working set-up but when I try to plot the RooAddPdf components, there are displayed with weird shaped bins.
Please find the relevant code snippet below. hData, hQCD and hEWK are TH1Fs.
ndata = hData.Integral()
    fitRangeMin =   250.0
    fitRangeMax =  4000.0

    # Define fit variable axis
    varX = RooRealVar("varX",hData.GetXaxis().GetTitle(),fitRangeMin,fitRangeMax)

    # Define variables for fitted signal and QCD events
    newk  = RooRealVar("newk","number of events in the EWK signal",ndata*1./10., 1, ndata)
    nqcd  = RooRealVar("nqcd","number of events in the QCD background",ndata*9./10., 1, ndata)

    # Get the histograms for RooFit
    data     = RooDataHist("data" ,"data", RooArgList(varX), hData)
    ewk      = RooDataHist( "ewk" ,"EWK" , RooArgList(varX), hEWK)
    qcd      = RooDataHist( "qcd" ,"QCD" , RooArgList(varX), hQCD)

    # Set the histograms for ewk and qcd as PDFs
    ewkModel = RooHistPdf("ewkModel","RooFit template for EWK signal", RooArgSet(varX), ewk)
    qcdModel = RooHistPdf("qcdModel","RooFit template for QCD backgrounds" , RooArgSet(varX), qcd)

    # Prepare extended likelihood fit
    ewkShape = RooExtendPdf("ewkShape","EWK shape pdf", ewkModel, newk)
    qcdShape = RooExtendPdf("qcdShape","QCD shape pdf", qcdModel, nqcd)

    # Combine the models
    combModel = RooAddPdf("combModel","Combined model for EWK and QCD", RooArgList(ewkShape,qcdShape))

    # Fit - options provided are
    # RooFit.Extended(True) -> do extended likelihood fit
    # RooFit.Save(True) -> save RooFitResult object
    # RooFit.Minos(True) -> Call MINOS after HESSE, itself after MIGRAD
    fitResult = combModel.fitTo(data, RooFit.Extended(True), RooFit.Save(True), RooFit.Minos(True))

    can2 = makeCanvas('c2')
    can2.SetLogy()
    can2.cd()
    can2.SetLeftMargin(0.15)

    up2 = ROOT.TPad("mypad1", "mypad1", 0.0, 0.30, 1.0, 1.00)
    up2.SetBottomMargin(0)
    up2.SetLogy()
    up2.Draw()

    down2 = ROOT.TPad("mypad2", "mypad2", 0.0, 0.00, 1.0, 0.30)
    down2.SetTopMargin(0)
    down2.SetBottomMargin(0.2)
    down2.Draw()

    up2.cd()

    # Set up the plotting with RooFit
    xframe = varX.frame()
    #option tells plotOn to not take number density but number in histogram
    data.plotOn(xframe, RooFit.DataError(RooAbsData.SumW2))
    combModel.plotOn(xframe, RooFit.VisualizeError(fitResult))
    combModel.plotOn(xframe, RooFit.Components("ewkShape"), RooFit.LineColor(ROOT.kBlue))
    combModel.plotOn(xframe, RooFit.Components("qcdShape"), RooFit.LineColor(ROOT.kRed))
    combModel.plotOn(xframe, RooFit.LineColor(ROOT.kViolet))
    data.plotOn(xframe, RooFit.DataError(RooAbsData.SumW2)) #Data lies over all else, check that same as input TH1
    xframe.SetMaximum(1e4) #calls TH1::SetMaximum, helps with log scale
    xframe.SetMinimum(0.5)
    combModel.paramOn(xframe,RooFit.Layout(0.75,0.95,0.95))
    xframe.Draw()

    down2.cd()

    ROOT.gStyle.SetOptStat(0)

    xframedown = varX.frame()
    # Get fitted histogram by calculating number of bins manually
    nbins = (fitRangeMax-fitRangeMin)/hData.GetXaxis().GetBinWidth(1)
    hFitted = combModel.createHistogram("fitted_",varX,RooFit.Binning(int(nbins),fitRangeMin,fitRangeMax))
    #Scale with fit results, since PDFs are normalized to something-FIGURE OUT
#    print 'CHECK -', hFitted.Integral()
    integralBefore = hFitted.Integral()
    hFitted.Scale((nqcd.getVal()+newk.getVal())/integralBefore)
#    print 'CHECK -', hFitted.Integral()

    hDataAfter = data.createHistogram("data_",varX,RooFit.Binning(int(nbins),fitRangeMin,fitRangeMax))
#    hDataAfter.SetLineColor(ROOT.kViolet)
#    hDataAfter.Draw("EP SAME")
#    hFitted.SetLineColor(ROOT.kGreen)
#    hFitted.SetLineStyle(2)
#    hFitted.Draw("HIST SAME")

    hResidual = hDataAfter.Clone('DataAfter')
    hResidual.Divide(hFitted)
    hResidual.SetMaximum(1.5)
    hResidual.SetMinimum(0.5)
    hResidual.SetStats(False)
    hResidual.Draw()

#    xmin2 = up2.GetUxmin()
#    xmax2 = up2.GetUxmax()
    xmin2 = fitRangeMin
    xmax2 = fitRangeMax
    line2 = ROOT.TLine(xmin2,1,xmax2,1)
    line2.SetLineColor(ROOT.kRed)
    line2.SetLineStyle(2)
    line2.Draw('SAME')

    print 'Fitted # EWK: ',newk.getVal(), newk.getError()
    print 'Fitted # EWK: ',newk.Print()

    fitResult.Print()
Could you please tell me what I am doing wrong?
Thanks!
-Yaadav