Hello,
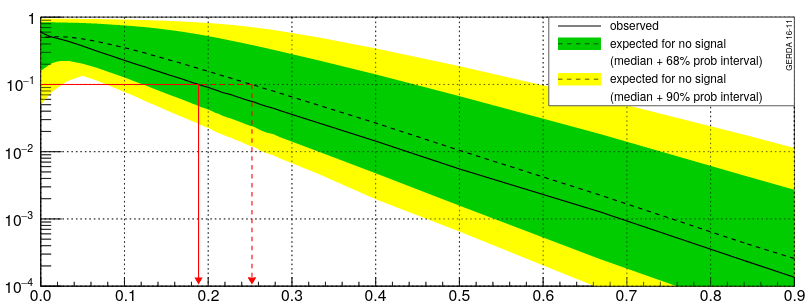
I want to change legend in p value plot drawn by StandardHypoTestInvDemo.C and also want to add arrows showing upper limit and expected upper limit like the one shown in the figure below.
I am trying to do it in the same macro but legend and arrows are not appearing on the plot.
Also could you tell me where all these cosmetics are done for this p value plot so that i can simply change text in that or change it according to my style.