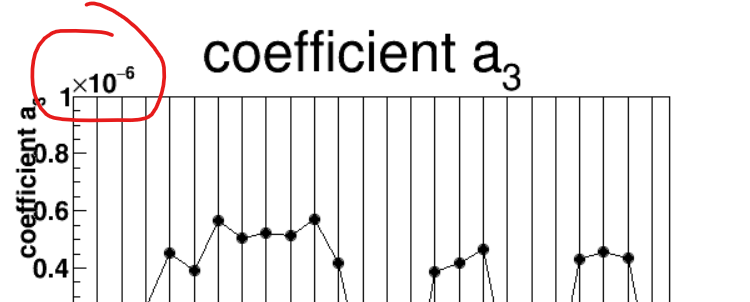
I am using scientific notation by TAXis::SetMaxDigits(N)
but when i do multiple plots without border or gap, says Divide(1,3,0,0), this exponent will get blocked.
Any method to access this guy and probably I can use SetNDC to move this guy around ?
...
   TGaxis::SetMaxDigits(2);
   TGaxis::SetExponentOffset(-0.01, 0.01, "y"); // X and Y offset for Y axis
   TGaxis::SetExponentOffset(-0.05, 0.01, "x"); // Y and Y offset for X axis
...
   hist->Draw();