Hi all, I am trying TRatioPlot recently, where I followed steps from ROOT: TRatioPlot Class Reference.
However it seems error bars is plotted for h1. What if I want to plot h2/h1 (reverse the arguments to TRatioPlot(h2,h1)), with the error bars for h1. Is there any method to explicitly set the plot style ? (something like HIST C options, but for individual histogram in the TRatioPlot)
void ratioplot1() {
gStyle->SetOptStat(0);
auto c1 = new TCanvas("c1", "A ratio example");
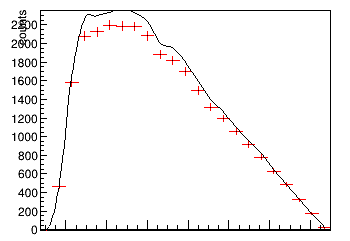
auto h1 = new TH1D("h1", "h1", 50, 0, 10);
auto h2 = new TH1D("h2", "h2", 50, 0, 10);
auto f1 = new TF1("f1", "exp(- x/[0] )");
f1->SetParameter(0, 3);
h1->FillRandom("f1", 1900);
h2->FillRandom("f1", 2000);
h1->Sumw2();
h2->Scale(1.9 / 2.);
h1->GetXaxis()->SetTitle("x");
h1->GetYaxis()->SetTitle("y");
auto rp = new TRatioPlot(h1, h2);
c1->SetTicks(0, 1);
rp->Draw();
rp->GetLowYaxis()->SetNdivisions(505);
}
Thanks in advance
_ROOT Version: 6.24 (PyROOT via conda)
_Platform:Centos7
_Compiler: gcc9