In other words, my signal numbers are
37.3176
11.3302
2.34017
0.177408
0.110479
0.0282991
and background number is 34830.16
I want to get expected limit(1 sigma/2 sigma) each signal value.
You are probably scanning th values of your parameter of interest in a range too large. Try to plot the scan result and scan in a reduced region.
Attached is your modified macro scanning in [0,10]
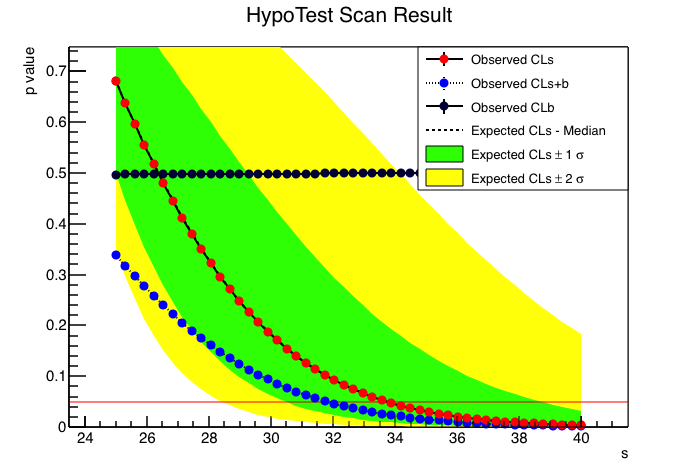
Your scan interval is probably not correct for those model values. I have tried in the interval [25,40] and this is what I get (see also attached figure)
in CountingModel.C
//my code
RooWorkspace w(“w”);
w.factory(“sum:nexp(s[10,0,135],b[10,0,34900])”); ///[color=#0000FF]nexp(s[nobs,nobs’s interval])[/color]//this is my understanding,is it something wrong?
w.factory(“Poisson:pdf(nobs[0,50],nexp)”);
w.factory(“Gaussian:constraint(b0[0,45],b,sigmab[1])”);
w.factory(“PROD:model(pdf,constraint)”);
//referance code
void CountingModel( int nobs = 3, // number of observed events
double b = 1, // number of background events
double sigmab = 0.2 ) // relative uncertainty in b
{
RooWorkspace w(“w”);
// make Poisson model * Gaussian constraint
w.factory(“sum:nexp(s[3,0,15],b[1,0,10])”);
// Poisson of (n | s+b)
w.factory(“Poisson:pdf(nobs[0,50],nexp)”);[color=#0000FF]how to calculate 50? what is the meaning?[/color]
w.factory(“Gaussian:constraint(b0[0,10],b,sigmab[1])”);
w.factory(“PROD:model(pdf,constraint)”);
When defining a variable (a RooRealVar) in the workspace, for example,
w.factory("x[ value, xmin, xmax]");
you can provide initial value, and range, or only range. The range is used also during the minimisation to exclude regions which are unphyicals, e.g. where the pdf are not defined.
See also the constructors of RooRealVar