Hi,
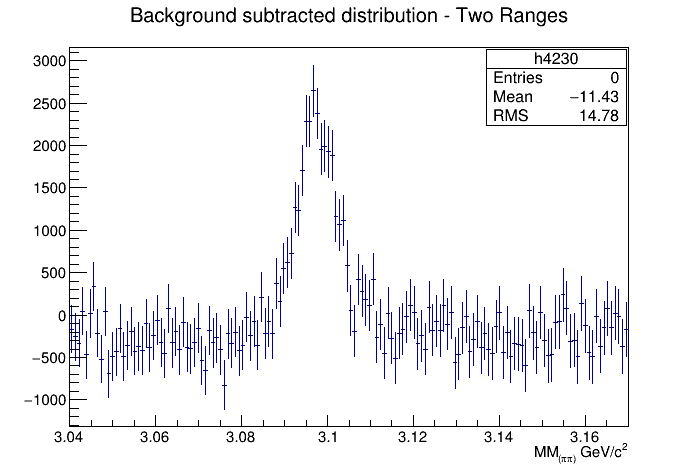
I’m trying to fit a histogram in two regions while excluding the signal region. and then I would like to subtract the fit function from the original histogram.
The fit is working perfectly but the problem is the background subtraction was not successful.
You can find my code and the pictures attached.
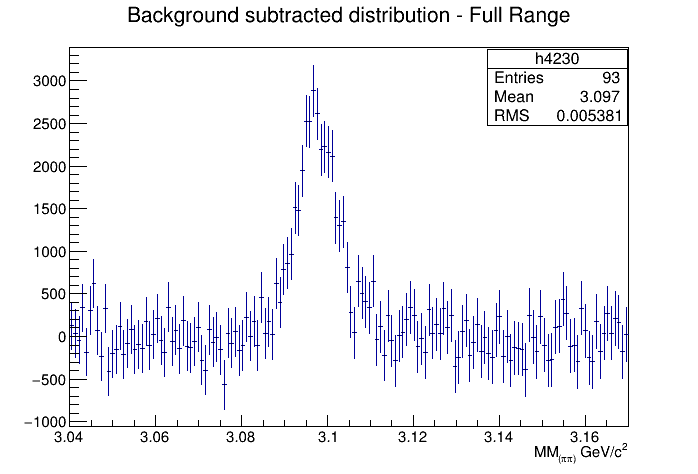
When I fit the full histogram, the background subtraction works. Could you please tell me what I’m doing wrong here?
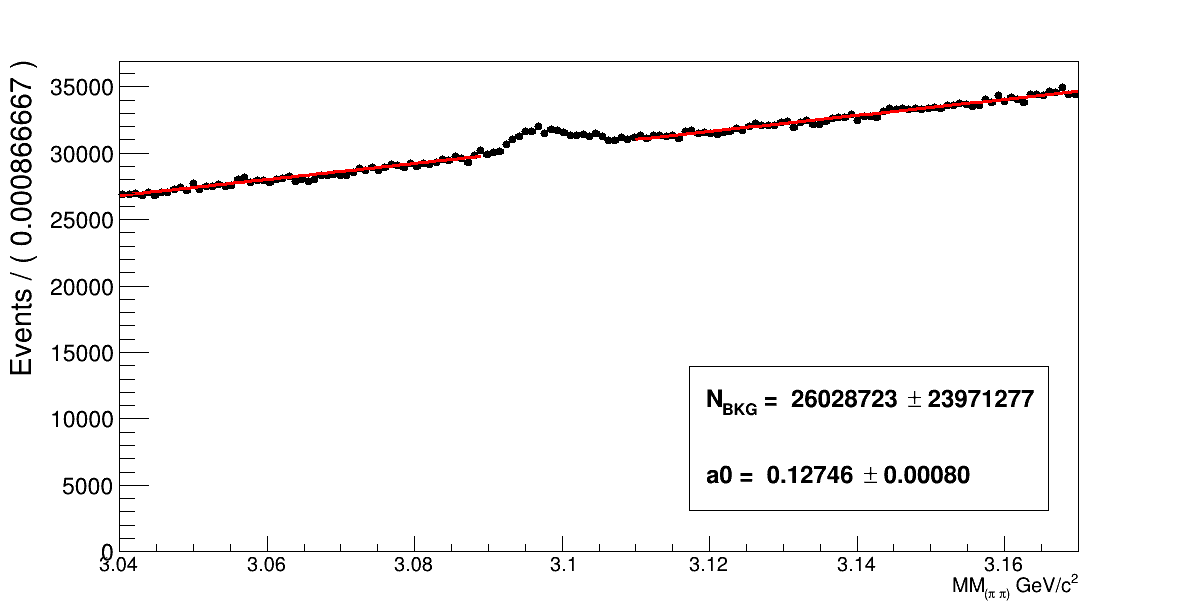
RooRealVar x("x","MM_{(#pi #pi)} GeV/c^{2}",3.04,3.17) ;
RooDataHist dh("dh","dataset",x,h1);
RooPlot* frame = x.frame(Title("2regions")) ;
x.setRange("Range1",3.04,3.089);
x.setRange("Range2",3.11,3.17);
dh.plotOn(frame,Name("dh")) ;
RooRealVar a0("a0","a0",-2.,2.) ;
RooRealVar a1("a1","a1",-2.,2.) ;
RooRealVar a2("a2","a2",-2.,2.) ;
RooChebychev bkg("bkg","background p.d.f.",x,RooArgList(a0));
RooRealVar nbkg("N_{BKG}","signal background even0ts",0,100000000);
RooAddPdf all("all","model",RooArgList(bkg),RooArgList(nbkg));
RooChi2Var chi2("chi2","chi2",all,dh,Range("Range1,Range2"),NumCPU(2));
RooMinuit m(chi2);
m.migrad();
m.hesse();
RooFitResult* r = m.save();
all.plotOn(frame,Range("Range1,Range2"),NormRange("Range1,Range2"),LineColor(kRed),Components(bkg));
all.paramOn(frame,Layout(0.5,0.90,0.55));
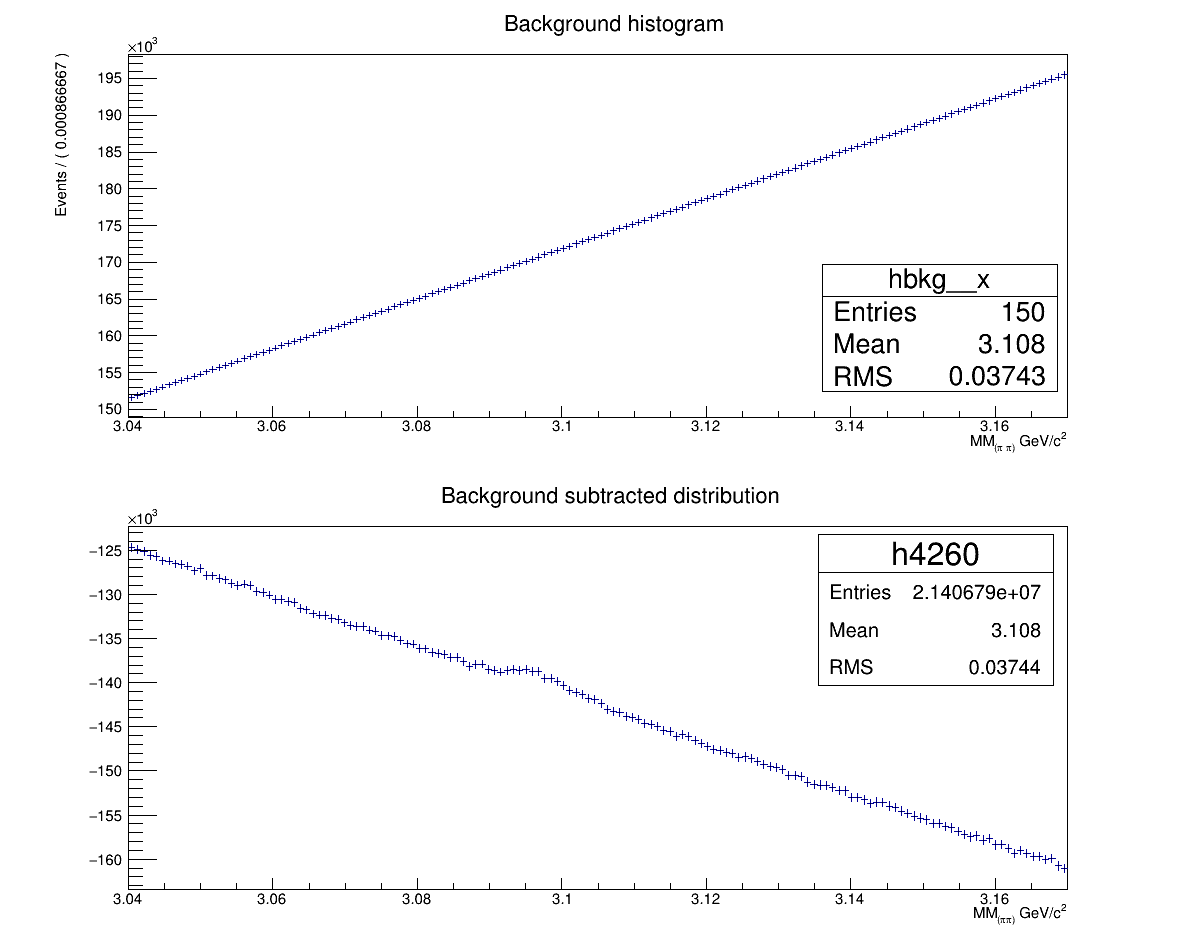
TH1 *hbkg = bkg.createHistogram("hbkg",x,Binning(150,3.04,3.17));
frame->Draw();
c2->Divide(1,2);
c2->cd(1);
hbkg->Scale(nbkg.getVal());
hbkg->Sumw2();
hbkg->Draw();
hbkg->SetTitle("Background histogram");
c2->cd(2);
TH1F *h4260 = (TH1F*)hist4260->Clone("h4260");
h4260->Sumw2();
h4260->Add(hbkg,-1);
h4260->Draw();
h4260->SetTitle("Background subtracted distribution");
h4260->GetXaxis()->SetTitle("MM_{(#pi#pi)} GeV/c^{2}");
TFile *file = new TFile("4260_2RG.root", "RECREATE");
h4260->Write();