I would like to exclude the central region (where the signal peak is) on a fit in order to fit the background on both sides together, in the same way that is demonstrated here with Root’s TF1: root.cern.ch/root/html/tutorials … ude.C.html
Is there a way to do this exclusion with RooFit’s PDFs, for log likelihood as well as for chi2 fits?
Yes, this can be done in a relatively straightforward way: you first define the regions that you want to be fittting in the observable(s) of your problem, e.g.
A subsequent plot of your pdf on data will default to plotting only the fitted ranges.
You can override the plotting default by adding a Range("") command to the
plotOn call (e.g. type “FULL” to plot the full range).
(Note that because you are dealing with pdfs in roofit rather than functions there is a
separate issue of which ranges you want to use to normalize the curve to the
data. By default this is the same as the plot range, but you could choose a different
range if you want with an additional NormRange() command in the plotOn call)
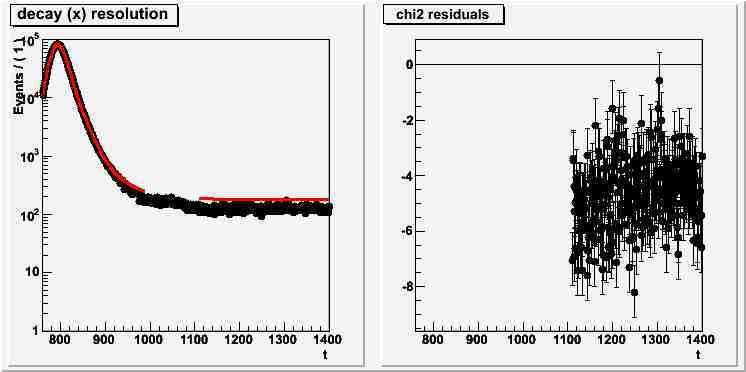
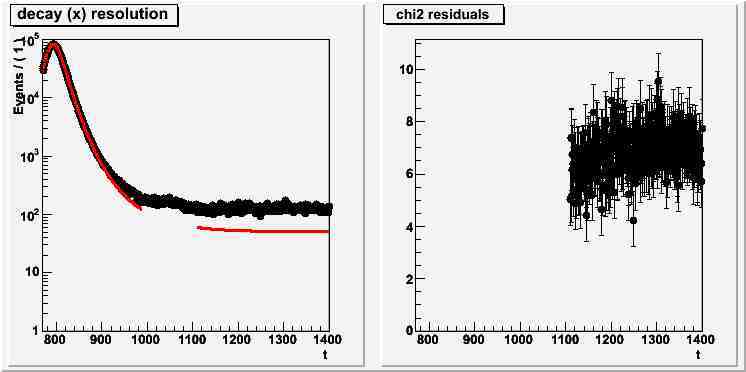
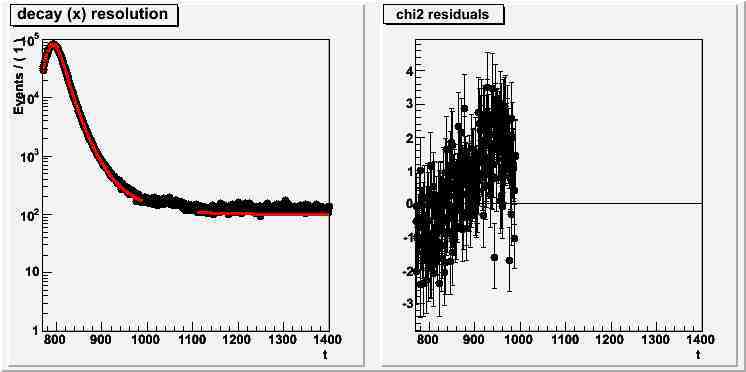
I’ve updated root to 5.26 and tried to swap intervals in RooChi2Var constructor. It seems that this constructor uses only last part of Range(“X,Y”) argument for interval preset. Below are pictures of my experiments. R1 = left range, R2 = right range.
Is there any other method to exclude range when fitting binned histogram with chi2 method as I described above? It would be useful to add this possibility if it’s absent now.