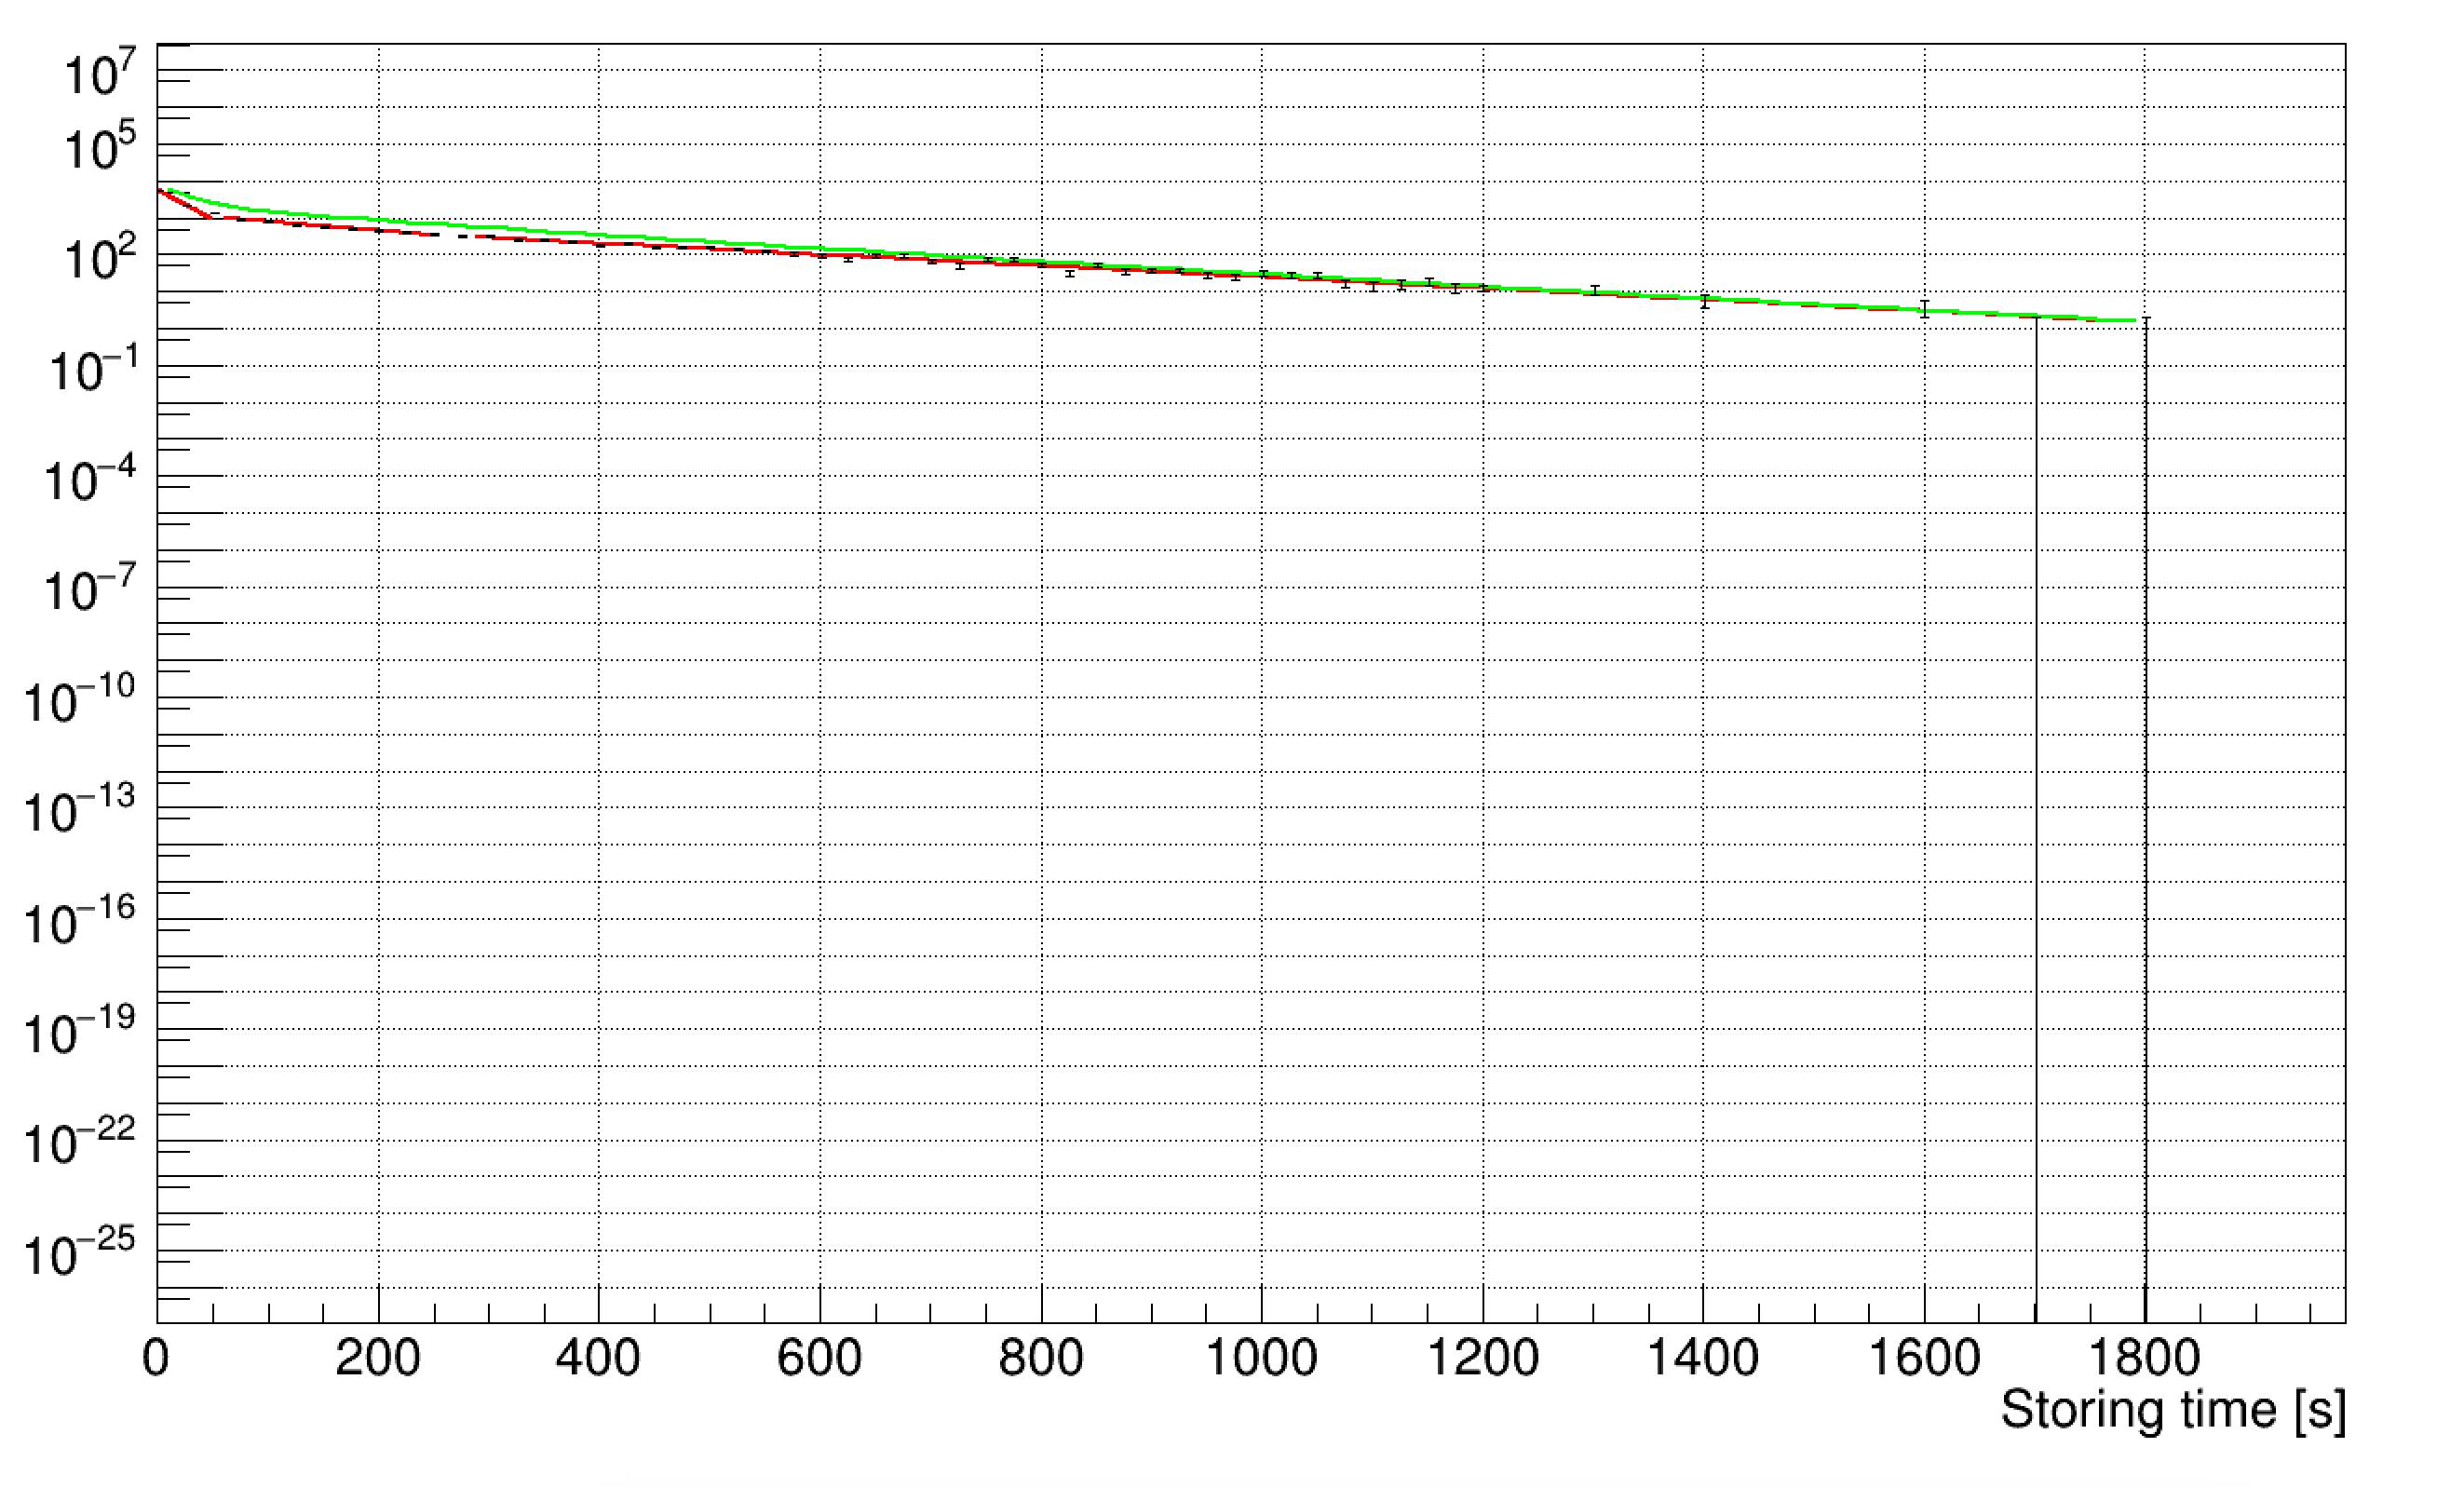
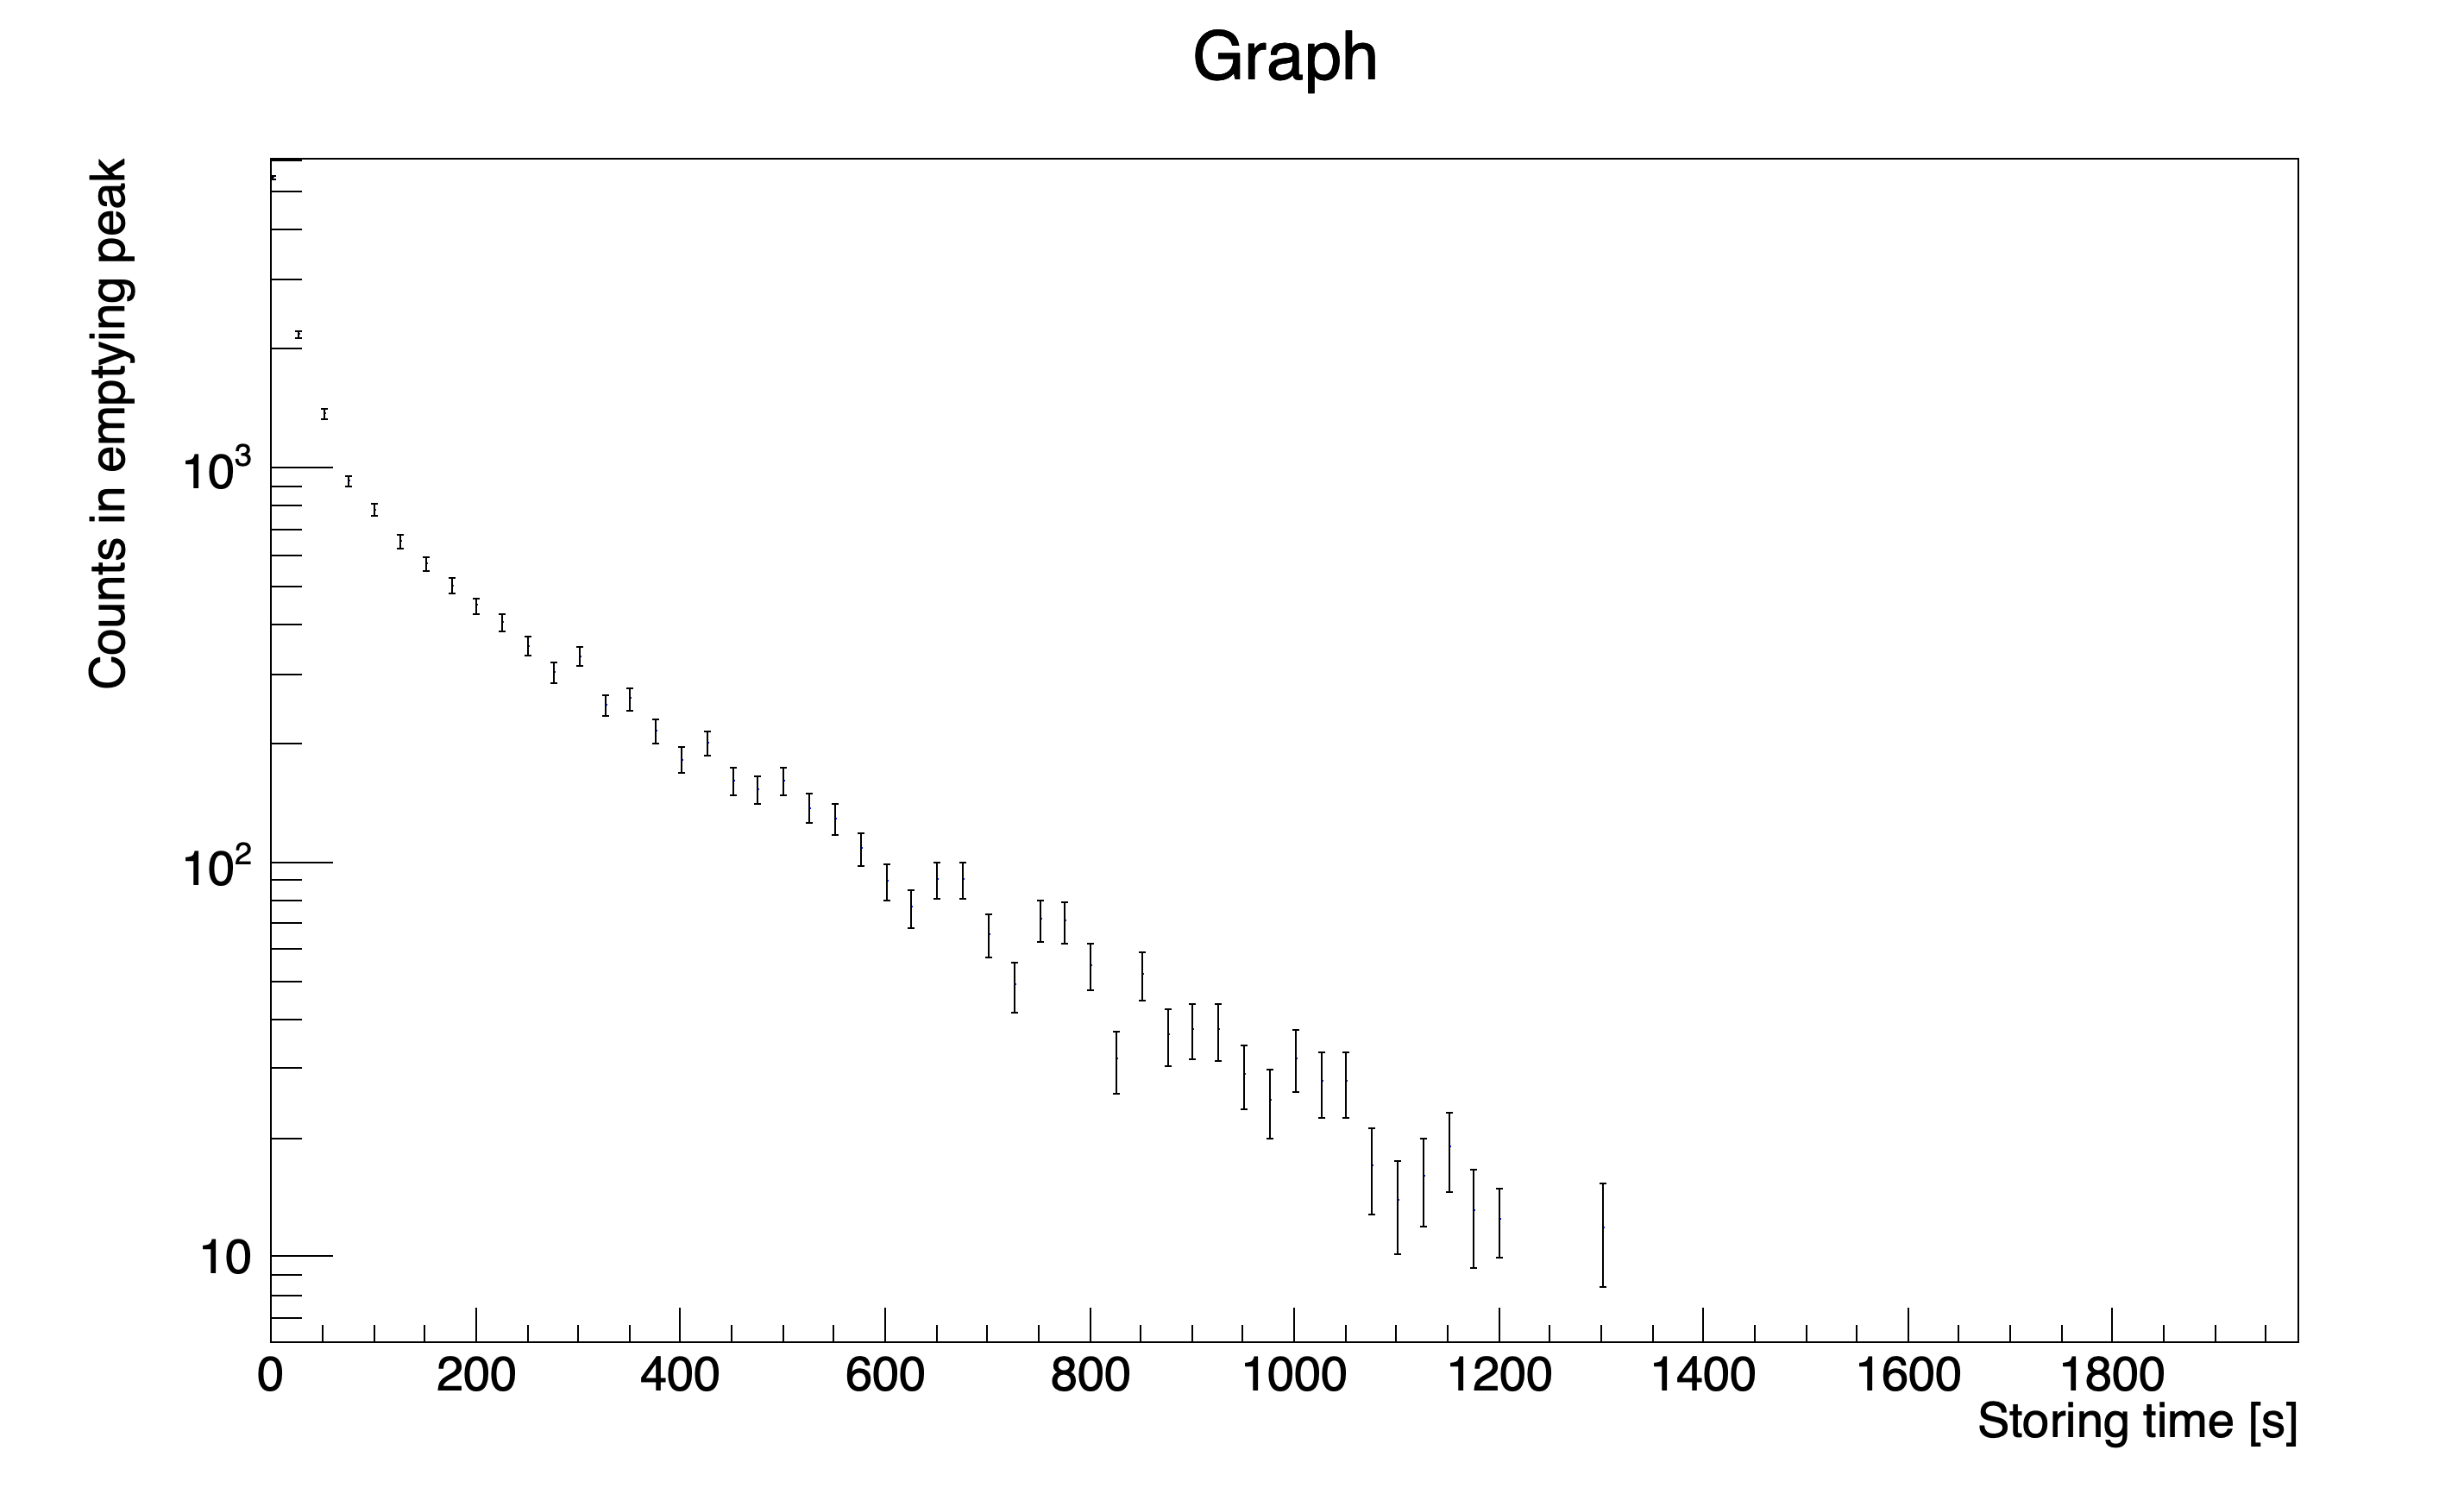
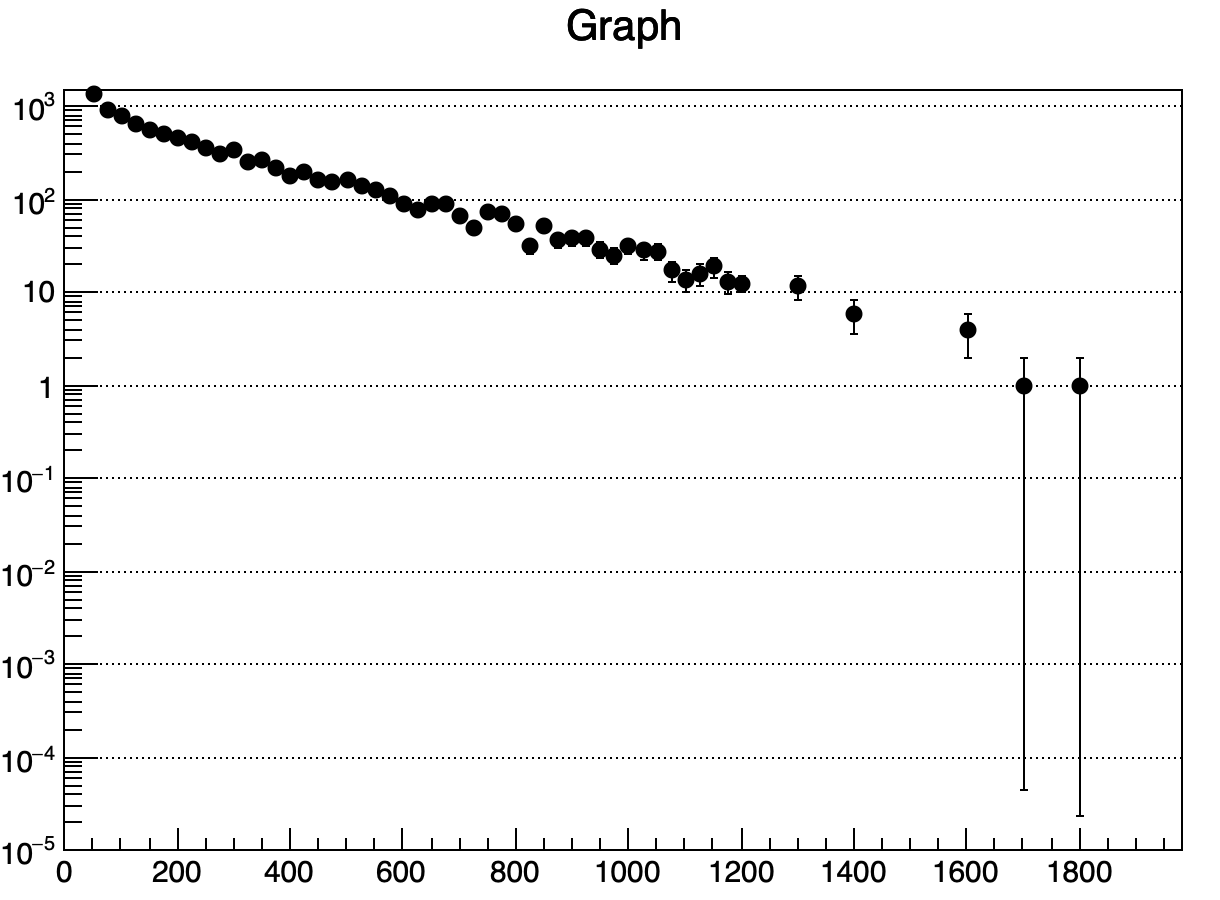
I attached a picture of my plot. It shows the problem, that for entries below 1 with associated errors below 1, the errors are drawn very weird on a log-scale. Can anyone explain this and maybe help me fix it? Is this simply, because for values lower than 1, e.g log(0.99), this value is negative and therefore cannot be represented in log?
void wfelix() {
   for (int entries = 0; entries < uniqueTimes.size(); entries++){
      nonzero_empty_peak_store_ar[entries] = averagedCounts[entries];
      nonzero_empty_peak_store_error_ar[entries] = errorOfAveragedCounts[entries];
      storingtimings_ar[entries] = uniqueTimes[entries];
   }

   times->cd(1);
   gPad->SetGrid();
   gPad->SetLogy();

   // create the TGraphErrors and draw it
   int length_ar = sizeof(nonzero_empty_peak_store_ar)/sizeof(nonzero_empty_peak_store_ar[0]);
   TGraphErrors *storing_times = new TGraphErrors(length_ar, storingtimings_ar, nonzero_empty_peak_store_ar, 0, nonzero_empty_peak_store_error_ar);
   storing_times->GetXaxis()->SetTitle("Storing time [s]");
   storing_times->GetYaxis()->SetTitle("Counts in emptying peak");
   storing_times->GetXaxis()->SetRangeUser(0,extractedNumbers_array[last_number][3]);
   storing_times->SetMarkerColor(4);
   storing_times->SetMarkerStyle(1);
   storing_times->Draw("AP");
}
Gives:
root [0] .x wfelix.C
In file included from input_line_12:1:
/Users/couet/roottest/wfelix.C:2:36: error: use of undeclared identifier 'uniqueTimes'
   for (int entries = 0; entries < uniqueTimes.size(); entries++){
                                   ^
/Users/couet/roottest/wfelix.C:3:7: error: use of undeclared identifier 'nonzero_empty_peak_store_ar'
      nonzero_empty_peak_store_ar[entries] = averagedCounts[entries];
      ^
/Users/couet/roottest/wfelix.C:3:46: error: use of undeclared identifier 'averagedCounts'
      nonzero_empty_peak_store_ar[entries] = averagedCounts[entries];
                                             ^
/Users/couet/roottest/wfelix.C:4:7: error: use of undeclared identifier 'nonzero_empty_peak_store_error_ar'
      nonzero_empty_peak_store_error_ar[entries] = errorOfAveragedCounts[entries];
      ^
/Users/couet/roottest/wfelix.C:4:52: error: use of undeclared identifier 'errorOfAveragedCounts'
      nonzero_empty_peak_store_error_ar[entries] = errorOfAveragedCounts[entries];
                                                   ^
/Users/couet/roottest/wfelix.C:5:7: error: use of undeclared identifier 'storingtimings_ar'
      storingtimings_ar[entries] = uniqueTimes[entries];
      ^
/Users/couet/roottest/wfelix.C:5:36: error: use of undeclared identifier 'uniqueTimes'
      storingtimings_ar[entries] = uniqueTimes[entries];
                                   ^
/Users/couet/roottest/wfelix.C:8:9: error: member reference base type 'clock_t (struct tms *)' (aka 'unsigned long (tms *)') is not a structure or union
   times->cd(1);
   ~~~~~^ ~~
/Users/couet/roottest/wfelix.C:13:27: error: use of undeclared identifier 'nonzero_empty_peak_store_ar'
   int length_ar = sizeof(nonzero_empty_peak_store_ar)/sizeof(nonzero_empty_peak_store_ar[0]);
                          ^
/Users/couet/roottest/wfelix.C:13:63: error: use of undeclared identifier 'nonzero_empty_peak_store_ar'
   int length_ar = sizeof(nonzero_empty_peak_store_ar)/sizeof(nonzero_empty_peak_store_ar[0]);
                                                              ^
/Users/couet/roottest/wfelix.C:14:62: error: use of undeclared identifier 'storingtimings_ar'
   TGraphErrors *storing_times = new TGraphErrors(length_ar, storingtimings_ar, nonzero_empty_peak_store_ar, 0, nonzero_empty_peak_store_error_ar);
                                                             ^
/Users/couet/roottest/wfelix.C:14:81: error: use of undeclared identifier 'nonzero_empty_peak_store_ar'
   TGraphErrors *storing_times = new TGraphErrors(length_ar, storingtimings_ar, nonzero_empty_peak_store_ar, 0, nonzero_empty_peak_store_error_ar);
                                                                                ^
/Users/couet/roottest/wfelix.C:14:113: error: use of undeclared identifier 'nonzero_empty_peak_store_error_ar'
   TGraphErrors *storing_times = new TGraphErrors(length_ar, storingtimings_ar, nonzero_empty_peak_store_ar, 0, nonzero_empty_peak_store_error_ar);
                                                                                                                ^
/Users/couet/roottest/wfelix.C:17:46: error: use of undeclared identifier 'extractedNumbers_array'
   storing_times->GetXaxis()->SetRangeUser(0,extractedNumbers_array[last_number][3]);
                                             ^
/Users/couet/roottest/wfelix.C:17:69: error: use of undeclared identifier 'last_number'
   storing_times->GetXaxis()->SetRangeUser(0,extractedNumbers_array[last_number][3]);
                                                                    ^
root [1]
I just used the interactive graph plot thing and chose SetRangeUser.
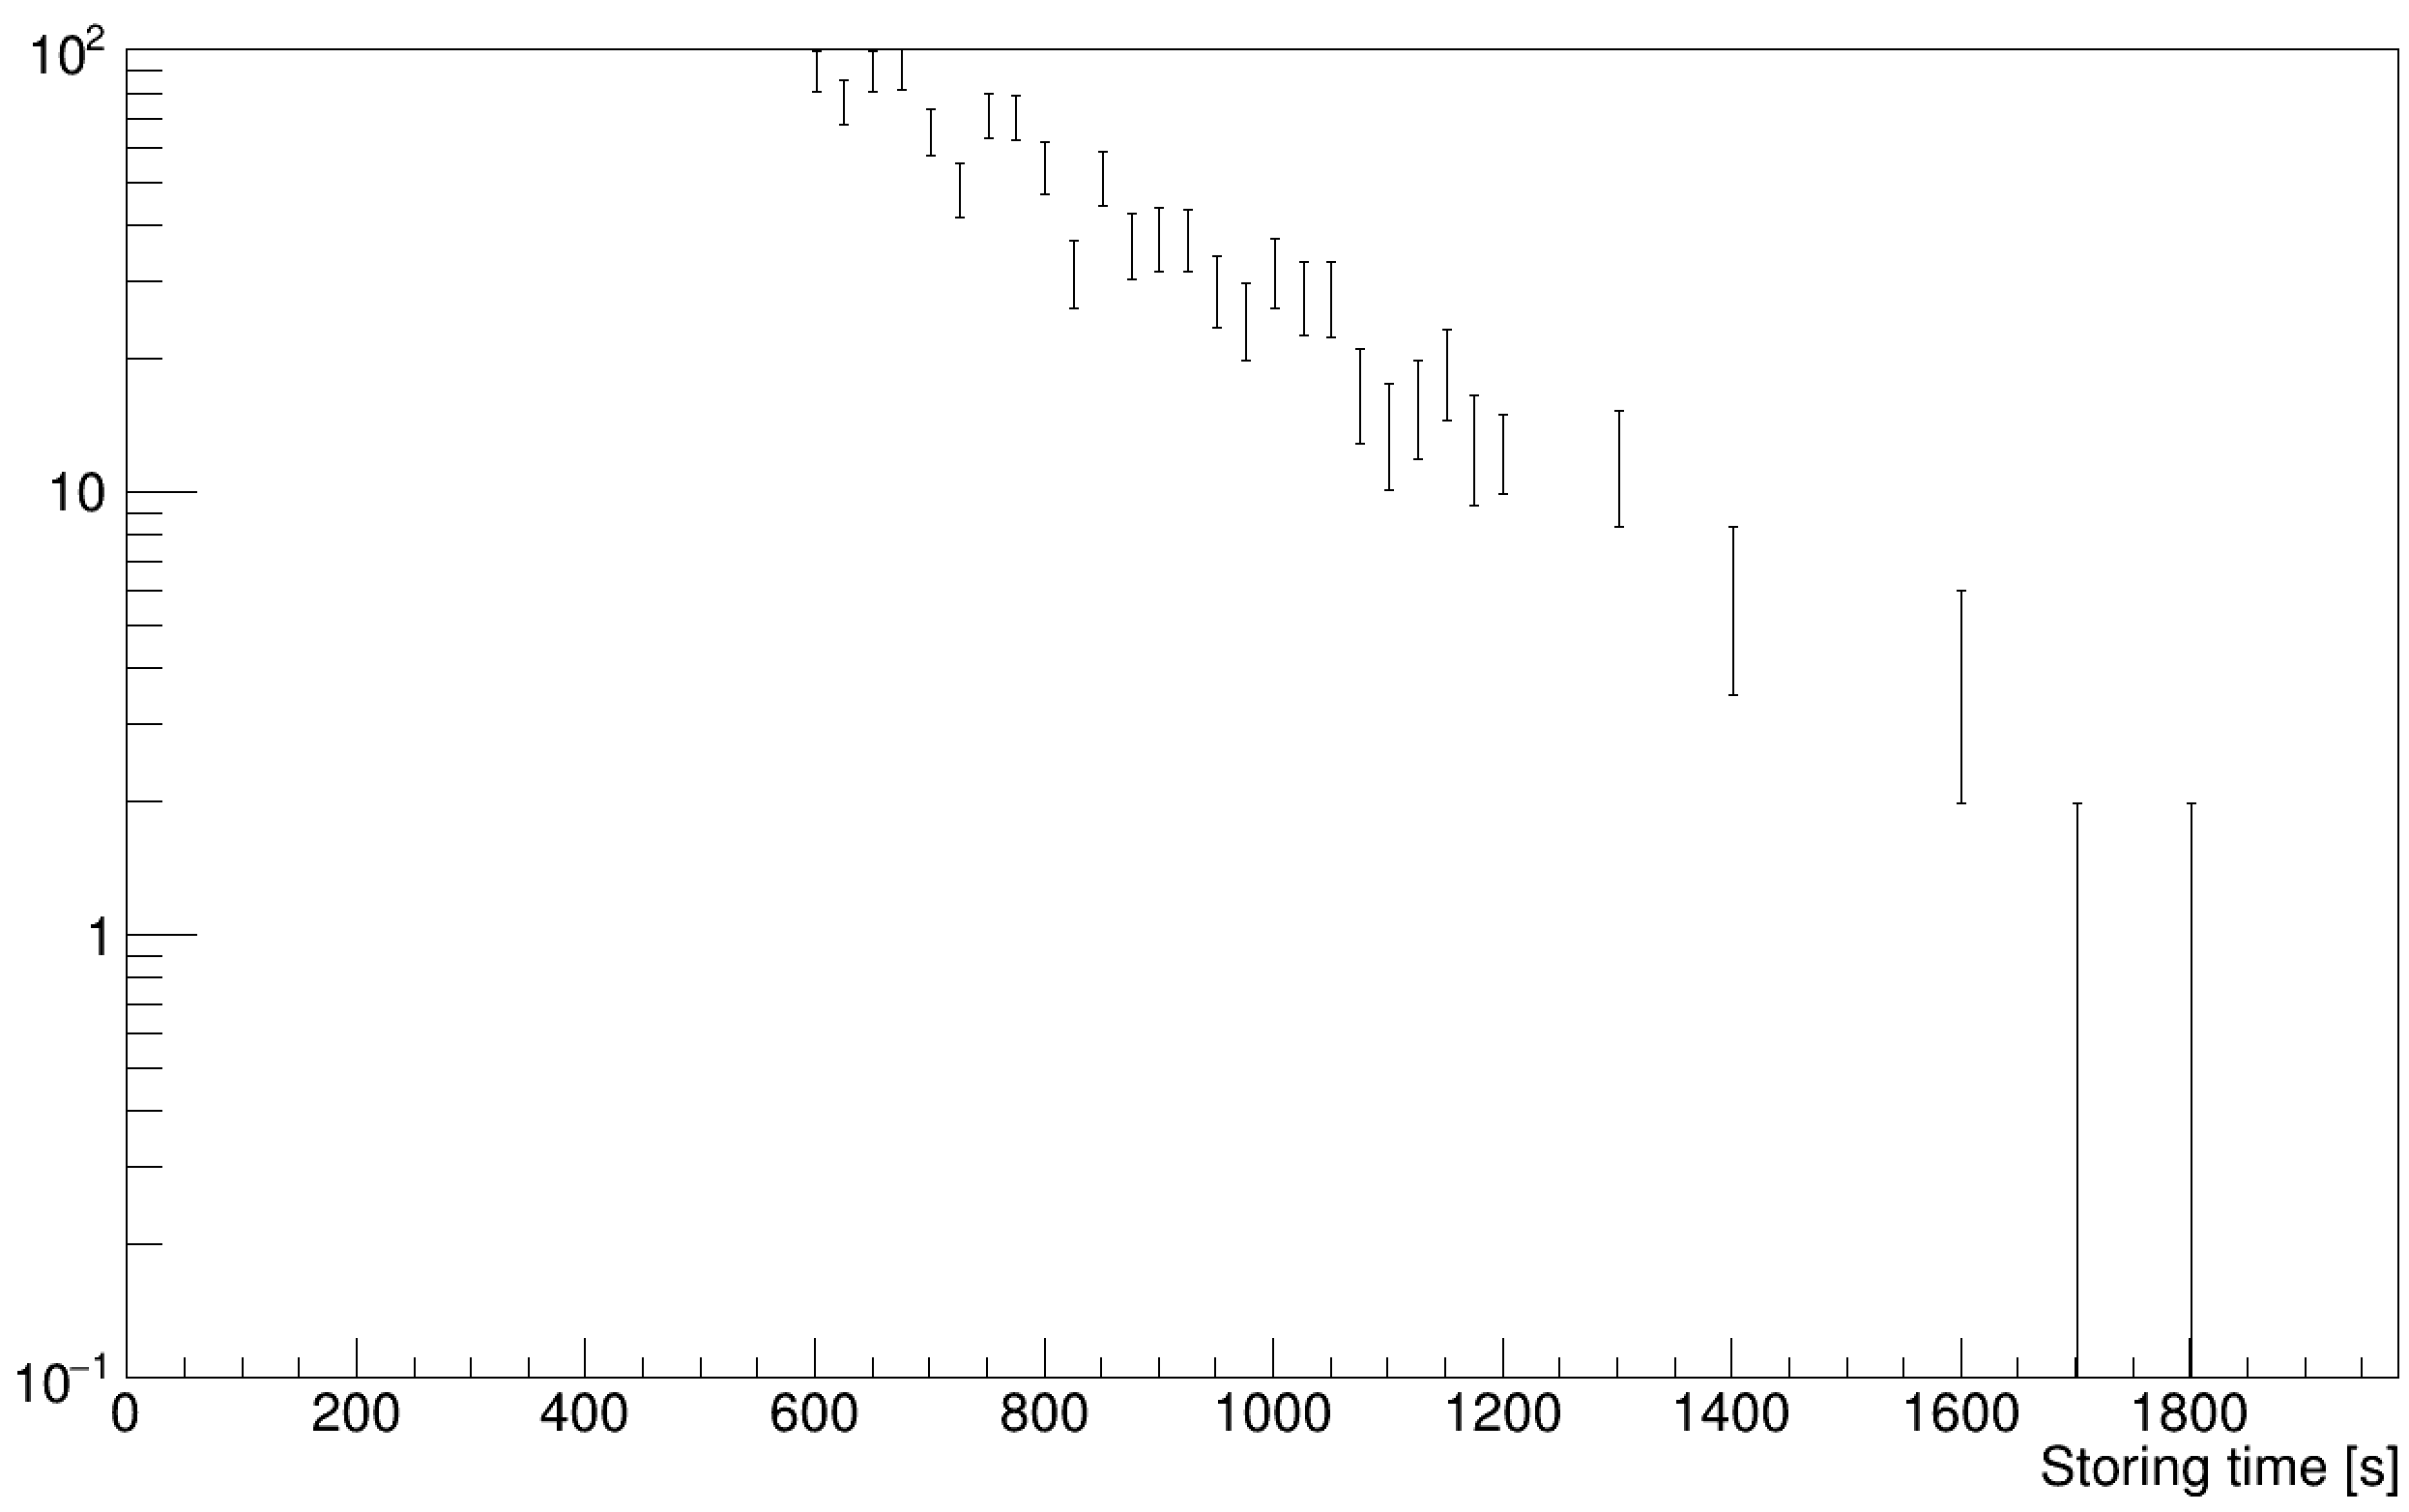
What’s even more weird: if I change the last two values to values above 1 (so both the value and its error), I STILL get the weird line in the log plot…
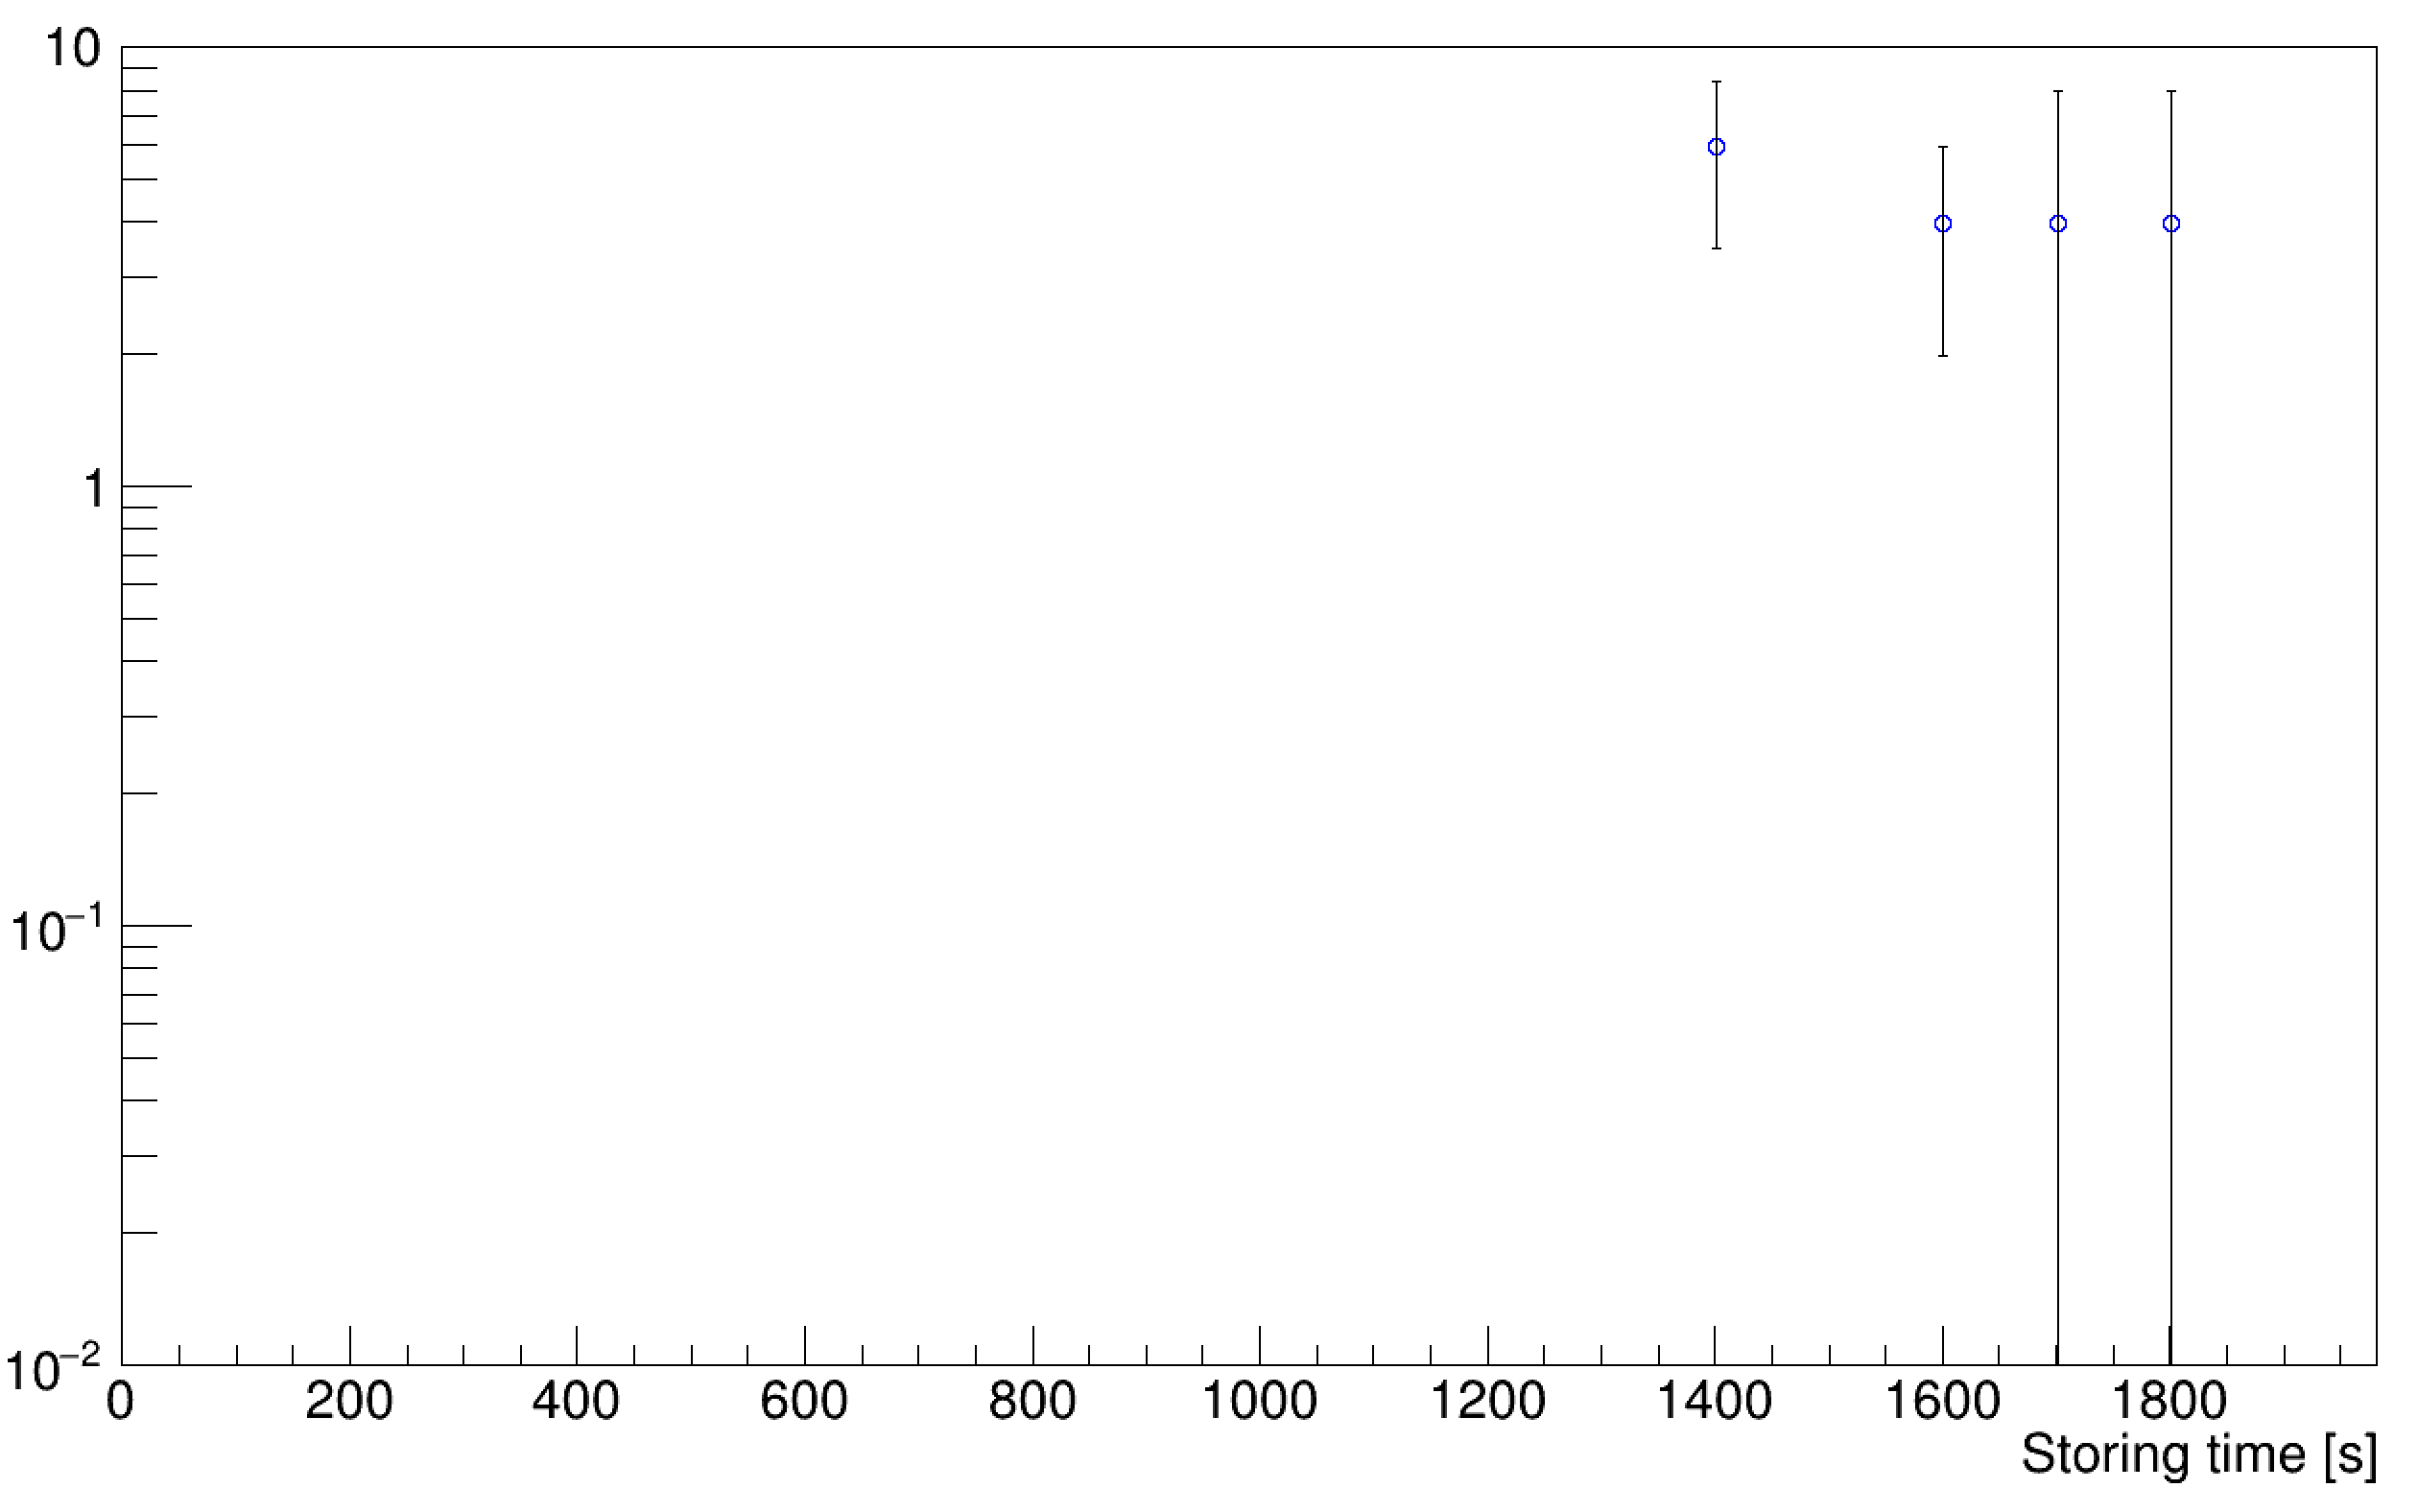
I simplified the variable name to make easier to read (for myself)
I put the right domesion for the vector (there is 54 etries not 60)
I made loop to check te validity of the low error (negative value are invalid)
if a negative valu is found I make it positive.
I set the Y axis range in the macro.
When I execute the macro I get:
root [1] .x wfelix.C
Point number 52 has an invalid low level error value -0.004528 in log scale
Point number 53 has an invalid low level error value -0.002376 in log scale