Hi,
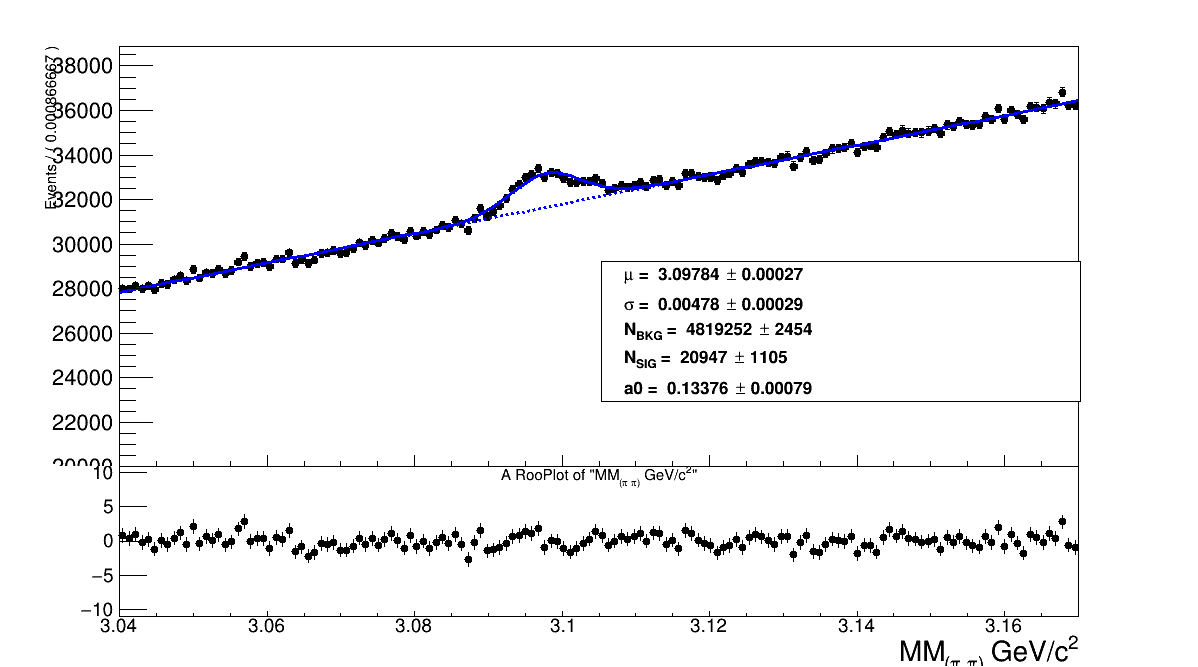
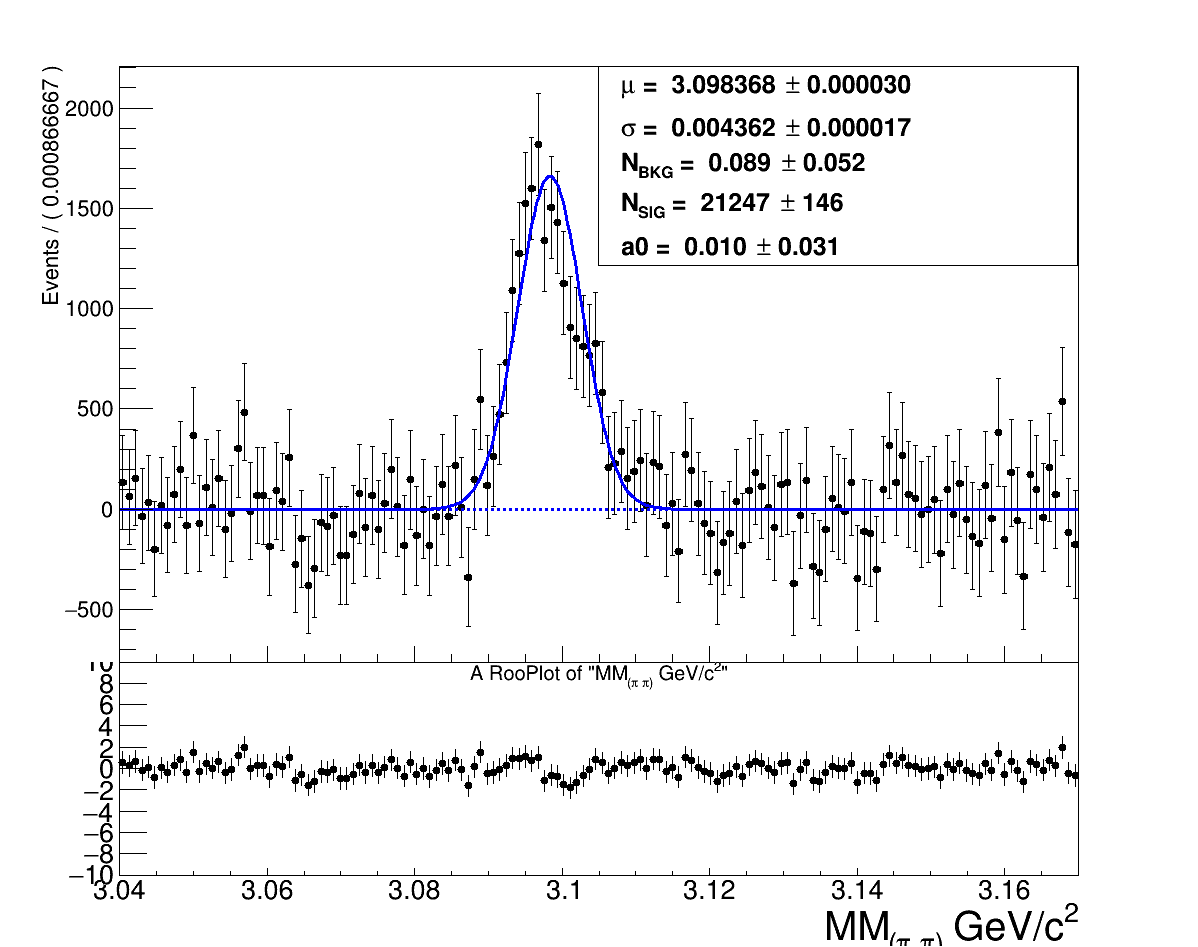
I subtracted a Chebychev polynomial from a histogram and after that I fit the background subtracted histogram with a gaussian and polynomial.
Before the subtraction I had Nsig = 20947 ± 1105
After the subtraction I had Nsig = 21247 ± 146
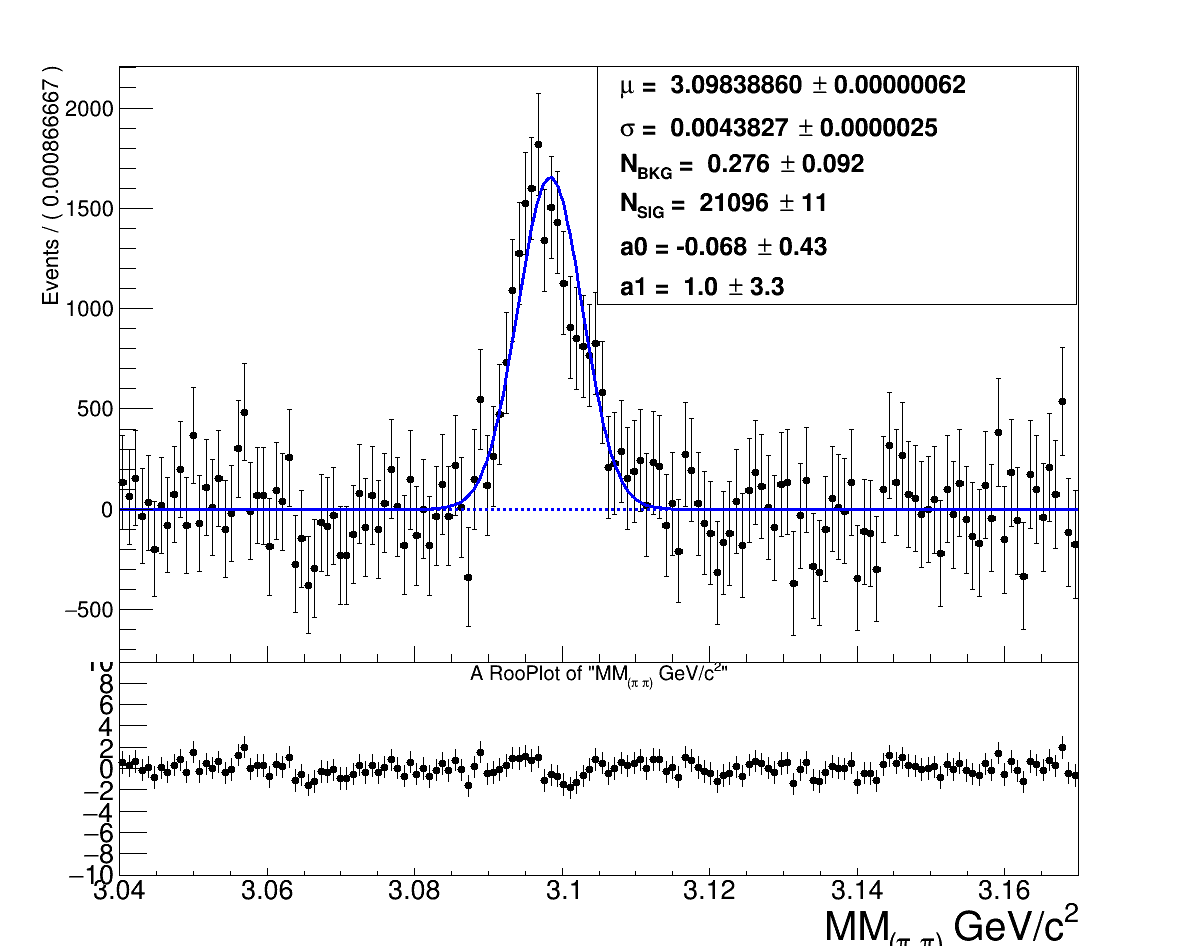
If I increment the order of polynomial the error after the subtraction is even smaller Nsig=21096 ± 11
Is there an explanation why I have this difference between the errors before and after the subtraction. Is it logical to see this result ?
My code for the subtraction
  RooRealVar x("x","MM_{(#pi #pi)} GeV/c^{2}",3.04,3.17) ;
  RooDataHist dh("dh","dataset",x,hist4260);
  RooPlot* frame = x.frame(Title("@4.26 GeV :: e^{+}e^{-} -> J/#psi #pi^{+} #pi^{-}")) ;
  dh.plotOn(frame,Name("dh")) ;
  RooRealVar mean1("#mu","mean of gaussians",3.095,3.098);
  RooRealVar sigma1("#sigma","width of gaussians",0.0025,0.006);
  RooGaussian sig1("sig1", "sig1", x, mean1, sigma1);
  RooRealVar a0("a0","a0",-2.,2.) ;
  RooRealVar a1("a1","a1",-2.,2.) ;
  RooRealVar a2("a2","a2",-2.,2.) ;
  RooRealVar a3("a3","a3",-2.,2.) ;
  RooChebychev bkg("bkg","background p.d.f.",x,RooArgList(a0));
  RooRealVar nsig("N_{SIG}","signal events",0,1000000);
  RooRealVar nbkg("N_{BKG}","signal background even0ts",0,100000000);
  RooAddPdf all("all","model",RooArgList(sig1,bkg),RooArgList(nsig,nbkg));
  RooFitResult* r = all.fitTo(dh,Extended(kTRUE),Save()) ;
  all.paramOn(frame,Layout(0.5,0.90,0.55));
  all.plotOn(frame,Components(bkg),LineStyle(kDashed));
  all.plotOn(frame,Name("all"));
  TH1 *hbkg = bkg.createHistogram("hbkg",x,Binning(150,3.04,3.17));

    r->Print();

  frame->GetXaxis()->SetTitle("");
  frame->GetXaxis()->SetLabelSize(1);
  frame->GetYaxis()->SetLabelSize(0.05);
  frame->SetMinimum(20000);

  RooPlot *residual= x.frame();
  RooHist *resHist = (RooHist*)frame->pullHist();
  residual->addObject(resHist,"PZ");
  residual->SetMinimum(-11.);
  residual->SetMaximum(+11.);
  residual->GetXaxis()->SetLabelSize(0.1);
  residual->GetXaxis()->SetTitleOffset(0.8);
  residual->GetXaxis()->SetTitleSize(0.15);
  residual->GetYaxis()->SetLabelSize(0.1);
  residual->GetYaxis()->SetNdivisions(110);

  TCanvas *c1 = new TCanvas("c1","Jpsi",1200,1200);
  c1->Divide(2);
  c1->GetPad(1)->SetPad(0.,0.3,1.,1.);
  c1->GetPad(2)->SetPad(0.,0.,1.,0.3);
  c1->GetPad(1)->SetBottomMargin(0);
  c1->GetPad(2)->SetTopMargin(0);
  c1->GetPad(2)->SetBottomMargin(0.25);
  c1->GetPad(2)->SetFillColor(4000);
  c1->cd(1);
  frame->Draw();
  c1->cd(2);
  residual->Draw();
My code for the fit after the subtraction
 TFile *f = new TFile("file4260.root");
  TH1F * h1 = new TH1F("h1","h1",150,3.04,3.17);
  h1 = (TH1F*)f.Get("h4260");

  RooRealVar x1("x1","MM_{(#pi #pi)} GeV/c^{2}",3.04,3.17) ;
  RooDataHist dh1("dh1","dataset",x1,h1);
  RooPlot* frame1 = x1.frame(Title("title")) ;
  dh1.plotOn(frame1,Name("dh1")) ;
  RooRealVar mean11("#mu","mean of gaussians",3.0965,3.0985);
  RooRealVar sigma11("#sigma","width of gaussians",0.002,0.0045);

  RooRealVar a0("a0","a0",-2.,2.) ;
  RooRealVar a1("a1","a1",-2.,2.) ;
  RooRealVar a2("a2","a2",-2.,2.) ;
  RooRealVar a3("a3","a3",-2.,2.) ;

  RooChebychev bkg("bkg","background p.d.f.",x1,RooArgList(a0,a1));

   RooRealVar nbkg("N_{BKG}","signal background even0ts",0,100000000);

  RooGaussian sig11("sig11", "sig11", x1, mean11, sigma11);
  RooRealVar nsig1("N_{SIG}","signal events",0,1000000);

  RooAddPdf all1("all1","model",RooArgList(sig11,bkg),RooArgList(nsig1,nbkg));

  RooFitResult* r1 = all1.fitTo(dh1,Extended(kTRUE),Save()) ;
  all1.paramOn(frame1,Layout(0.5,0.90,0.55));
  all1.plotOn(frame1,Name("all1"));
  all1.plotOn(frame1,Components(bkg),LineStyle(kDashed));
  all1.plotOn(frame1);
  r1->Print();

  RooPlot *residual1= x1.frame();
  RooHist *resHist1 = (RooHist*)frame1->pullHist();
  residual1->addObject(resHist1,"PZ");
  residual1->SetMinimum(-10.);
  residual1->SetMaximum(+10.);
  residual1->GetXaxis()->SetLabelSize(0.1);
  residual1->GetXaxis()->SetTitleOffset(0.8);
  residual1->GetXaxis()->SetTitleSize(0.15);
  residual1->GetYaxis()->SetLabelSize(0.1);
  residual1->GetYaxis()->SetNdivisions(110);

  TCanvas *c1 = new TCanvas("c1","Jpsi",1200,1200);
  c1->Divide(2);
  c1->GetPad(1)->SetPad(0.,0.3,1.,1.);
  c1->GetPad(2)->SetPad(0.,0.,1.,0.3);
  c1->GetPad(1)->SetBottomMargin(0);
  c1->GetPad(2)->SetTopMargin(0);
  c1->GetPad(2)->SetBottomMargin(0.25);
  c1->GetPad(2)->SetFillColor(4000);
  c1->cd(1);
  r1->Draw();
  frame1->Draw();
  c1->cd(2);
  residual1->Draw();