Hi,
I discovered that when plotting a TGraphErrors with error bars smaller than the markers, the bars are now displayed over the marker, pointing inward. I assume it’s a new feature dating back from release 6.26, given what I could guess from the release notes. That’s a very nice one, by the way.
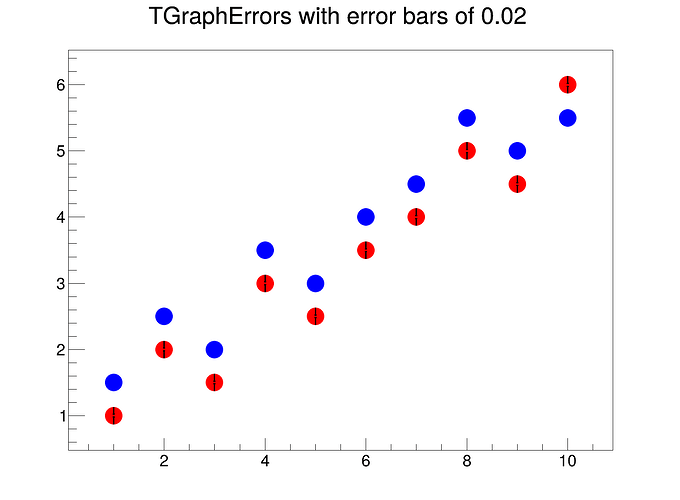
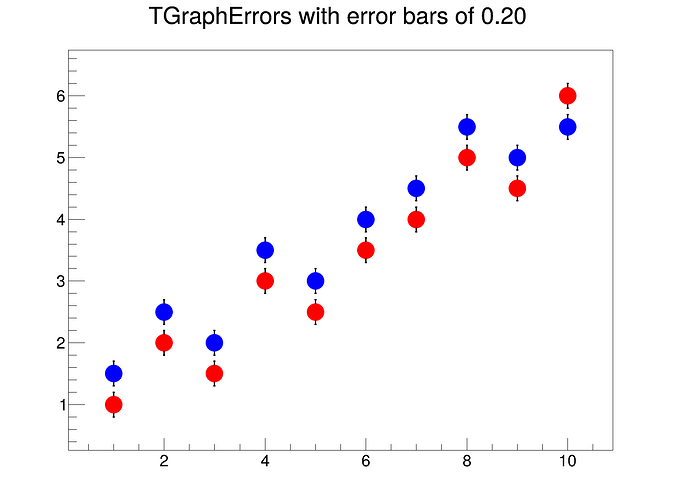
However I noticed that these bars do not appear if a second graph is drawn. If the error bars are increase by hand so that they become larger than the markers, then they appear on both graphs.
Here is a minimal working environment to confirm this:
#include "TGraphErrors.h"
#include "TCanvas.h"

int main() {

    const int nPoints = 10;
    double x[nPoints] = {1, 2, 3, 4, 5, 6, 7, 8, 9, 10};
    double y2[nPoints] = {1.5, 2.5, 2, 3.5, 3, 4, 4.5, 5.5, 5, 5.5};
    double y1[nPoints] = {1, 2, 1.5, 3, 2.5, 3.5, 4, 5, 4.5, 6};
    double ex[nPoints] = {0, 0, 0, 0, 0, 0, 0, 0, 0, 0};
    double eyy = 0.02;
    double ey[nPoints] = {eyy, eyy, eyy, eyy, eyy, eyy, eyy, eyy, eyy};

    TGraphErrors *graph1 = new TGraphErrors(nPoints, x, y1, ex, ey);
    TGraphErrors *graph2 = new TGraphErrors(nPoints, x, y2, ex, ey);

    TCanvas *canvas = new TCanvas("canvas", "TGraphErrors Example", 1600, 1200);

    graph1->SetMarkerStyle(20);
    graph1->SetMarkerColor(kRed);
    graph1->SetMarkerSize(5);
    graph1->SetLineWidth(3);
    graph1->SetTitle(Form("TGraphErrors with errors bars of %.2f", eyy));

    graph2->SetMarkerStyle(20);
    graph2->SetMarkerColor(kBlue);
    graph2->SetMarkerSize(5);
    graph2->SetLineWidth(3);

    graph1->Draw("AP");
    graph2->Draw("P SAME");

    canvas->SaveAs(Form("MWE_error_bars_%.2f.png", eyy));
}
and here are 2 versions of the output plot obtained for vertical error bars of 0.02 and 0.2:
Could this be a bug? Maybe the new feature has not been implemented “recursively” so that it can work nicely with the “same” option for draw().
Cheers,
Tristan
ROOT Version: 6.32.02


