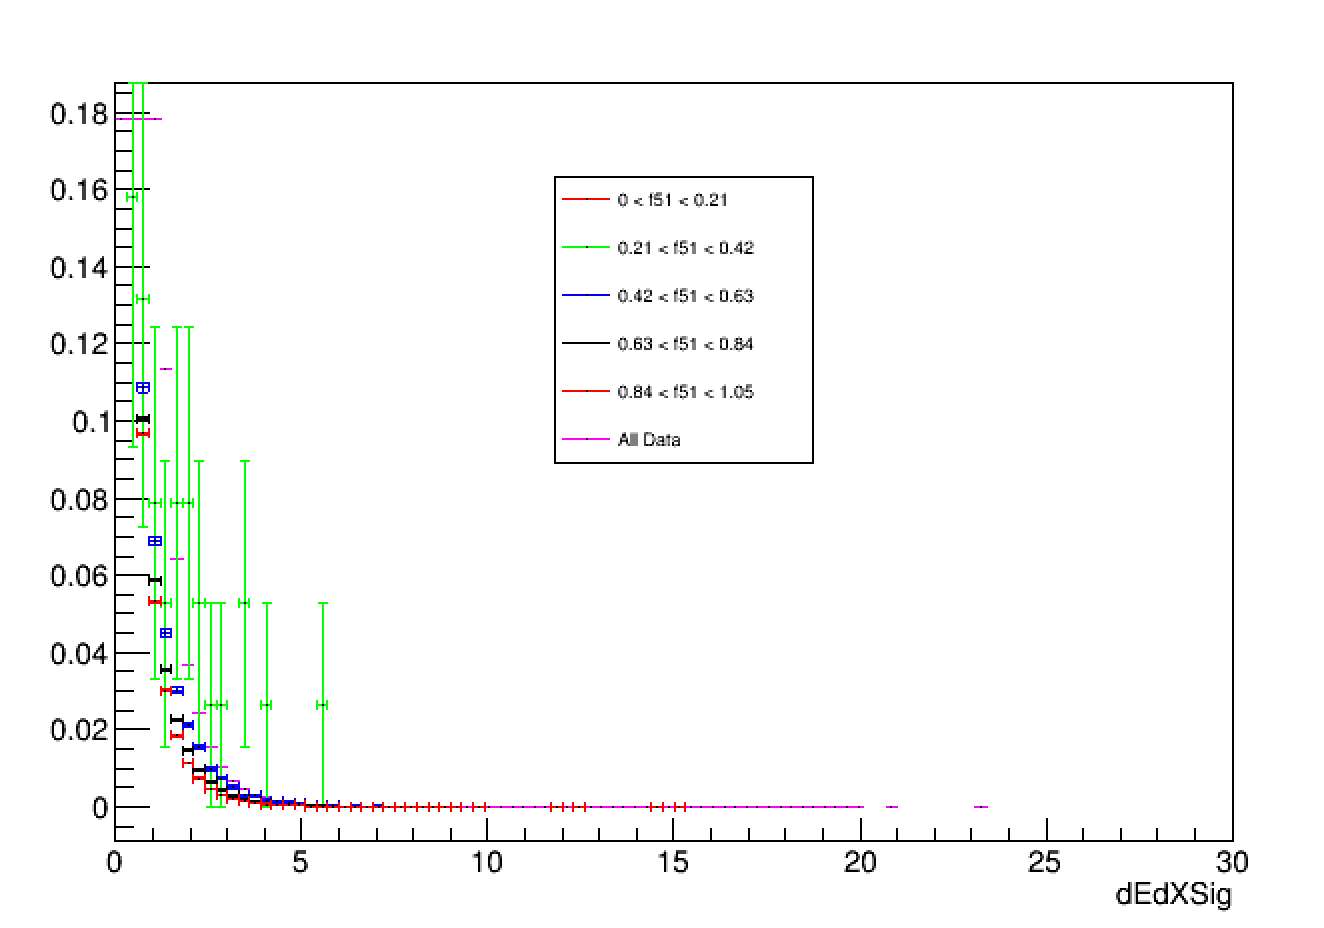
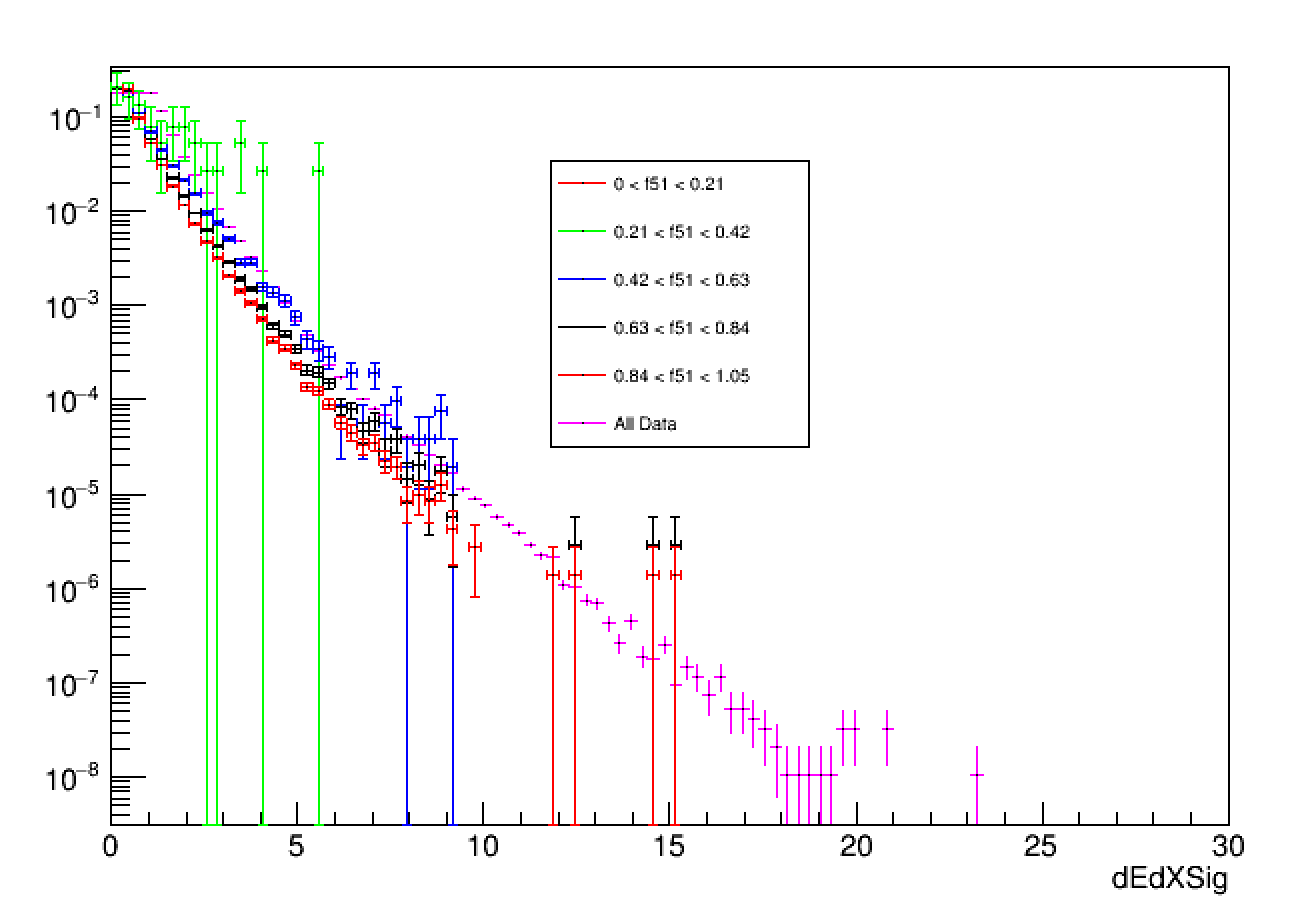
I ma trying to draw a variable from the same file and tree but with different cuts of other variable in order to study the systematic uncertainty in the shape of the distribution. i have plotted all the histograms on top of each others plus the plot of the variable without any cut. i did a small macro to do this but i couldn’t draw the error bars. i am attaching the plot i produced and the macro when i added the option “E SAME” and the error bars reached the lower edge which i think it is correct.
Thanks, now it is getting better … but when i removed the Y log scale it becomes better , is that mean that this behavior (to reach the x axis ) is related to the log scale???