I am using root ver. 5.13/04. I making a plot which includes TGraphAsymmErrors with the x-error width so as to make a shaded band to represent systematic errors. Everything works but when I make the axis a log scale these bands extend off the plot area and sometimes off the canvas, down into the actual text in my document
Is there a way to enforce cropping? I save as .eps files.
Thanks for looking into it. I cannot actually make the .root file - when I click on Save ->canvas.root I get a crash of root - I tried running it through gdb but it didn’t help me:
Info in TCanvas::Print: eps file AlternativeAwaySideC9876.eps has been created
root [1] terminate called after throwing an instance of ‘std::bad_alloc’
what(): St9bad_alloc
Program exited with code 06.
(gdb) No stack.
(gdb)
I made a little tar file with my macro etc. in it - if you untar it and run centdists.C it is the last plot that comes up. I don’t know if that helps. I can’t find anyone else who seems to have the same problem as me :-/
Processing centdists.C...


Setting style info as per ~/STARtutorial/MJNHStyle.C


These styles settings are optimised for a single 400x400 canvas
when creating EPS files of multiple panel plots scale sizes by 400 divided by longest
edge of new plot.
Calling drawplot ...
Error: Function DrawPlot(nsg[i][0],nsg[i][1],nsg[i][2],nsg[i][3],nsg_sys[i][0],nsg_sys[i][1],nsg_sys[i][2],nsg_sys[i][3],nsr[i][0],nsr[i][1],nsr[i][2],nsr[i][3],nsr_sys[i][0],nsr_sys[i][1],nsr_sys[i][2],nsr_sys[i][3],kTRUE,i) is not defined in current scope  centdists.C:92:
*** Interpreter error recovered ***
Can you send me something running which reproduces your problem with error bars in log scale ?
It works on my computer, starting from the .tar.gz file I uploaded:
[quote]horner@horner1:~$ cd FromRootTalk/
horner@horner1:~/FromRootTalk$ tar -zxvf ForRene.tar.gz
GraphFile-C21.root
GraphFile-C43.root
GraphFile-C65.root
GraphFile-C9876.root
MJNHStyle.C
centdists.C
horner@horner1:~/FromRootTalk$ root centdists.C
Warning in TEnvRec::ChangeValue: duplicate entry <Canvas.HighLightColor=0> for level 1; ignored
Error in TCint::LoadLibraryMap: library map empty, no system.rootmap file
found.
*
W E L C O M E to R O O T *
*
Version 5.13/04 10 October 2006 *
*
You are welcome to visit our Web site *
[root.cern.ch](http://root.cern.ch) *
*
FreeType Engine v2.1.9 used to render TrueType fonts.
Compiled on 28 October 2006 for linux with thread support.
CINT/ROOT C/C++ Interpreter version 5.16.15, September 21, 2006
Type ? for help. Commands must be C++ statements.
Enclose multiple statements between { }.
root [0]
Processing centdists.C…
Setting style info as per ~/STARtutorial/MJNHStyle.C
These styles settings are optimised for a single 400x400 canvas
when creating EPS files of multiple panel plots scale sizes by 400 divided by longest
edge of new plot.
Calling drawplot …
Error: non class,struct,union object $gPad used with . or ->Creating canvas …
Creating axes …
Drawing systematics …
Drawing outlined points …
Making legend …
Making outline legend …
Making centrality string …
Making region string …
Making plots …
Info in TCanvas::Print: eps file AlternativeNearSideC9876.eps has been created
Creating canvas …
Creating axes …
Drawing systematics …
Drawing outlined points …
[/quote]
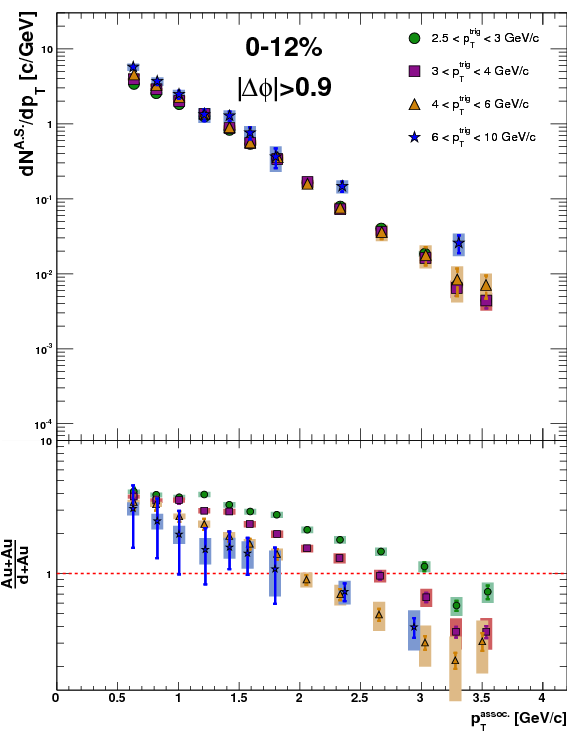
Your plots are always in Log scale along the Y axis. But you define your frame the following way:
axes2 = new TH2F("axes2",";p_{T}^{assoc.}[GeV/c];#frac{Au+Au}{d+Au}",100,0,4.2.2,150,-10,10);
As the log of a negative number (here -10) is invalid, ROOT take a % of the axis maximum to define a valid axis minimum. But in your case this “automatic minimum” is not enough. I would recommend you to define valid positive log scales. That way, your clipping problem will disapear. Do:
axes2 = new TH2F("axes2",";p_{T}^{assoc.}[GeV/c];#frac{Au+Au}{d+Au}",100,0,4.2.2,150,0.01,10);