I am trying to make a TH1 with errors which, for readability reasons, needs to have the y-axis go from 0-3 only. One of the points in this histogram is 5 ± 3, so the lower edge of the error bar should be visible in the plot. However, since the central value is out of the range, this point is excluded from the plot. Is there any way for me to get this point to be shown, without changing the y-axis?
This happens in both 5.26 and 5.28. I have attached a quick example. The example draws two histograms with the same contents and errors, the only difference is the y-axis range. On the second plot, many of the points are not shown, even though their error bars are in the range of the plot. roottalk.C (353 Bytes)
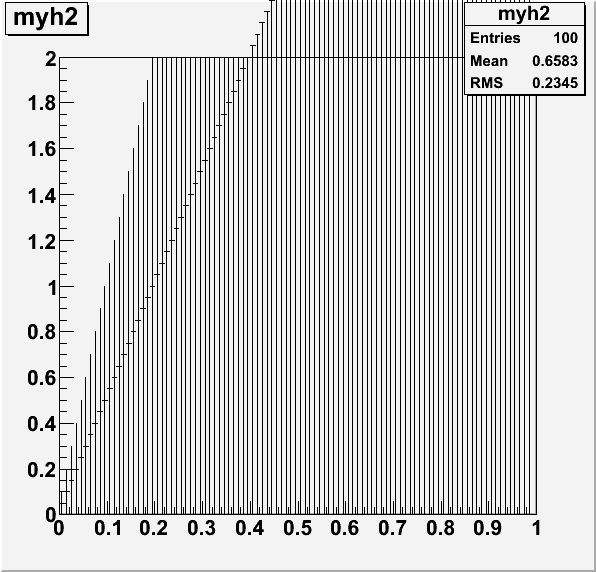
It does draw the error bars, but now they are drawn so that they extend to the edges of the canvas, rather than the frame, as you can see in the attached plot. Is there any way to keep these bars inside of the frame?