Error band from fitting using TMultiGraph

Hi all,
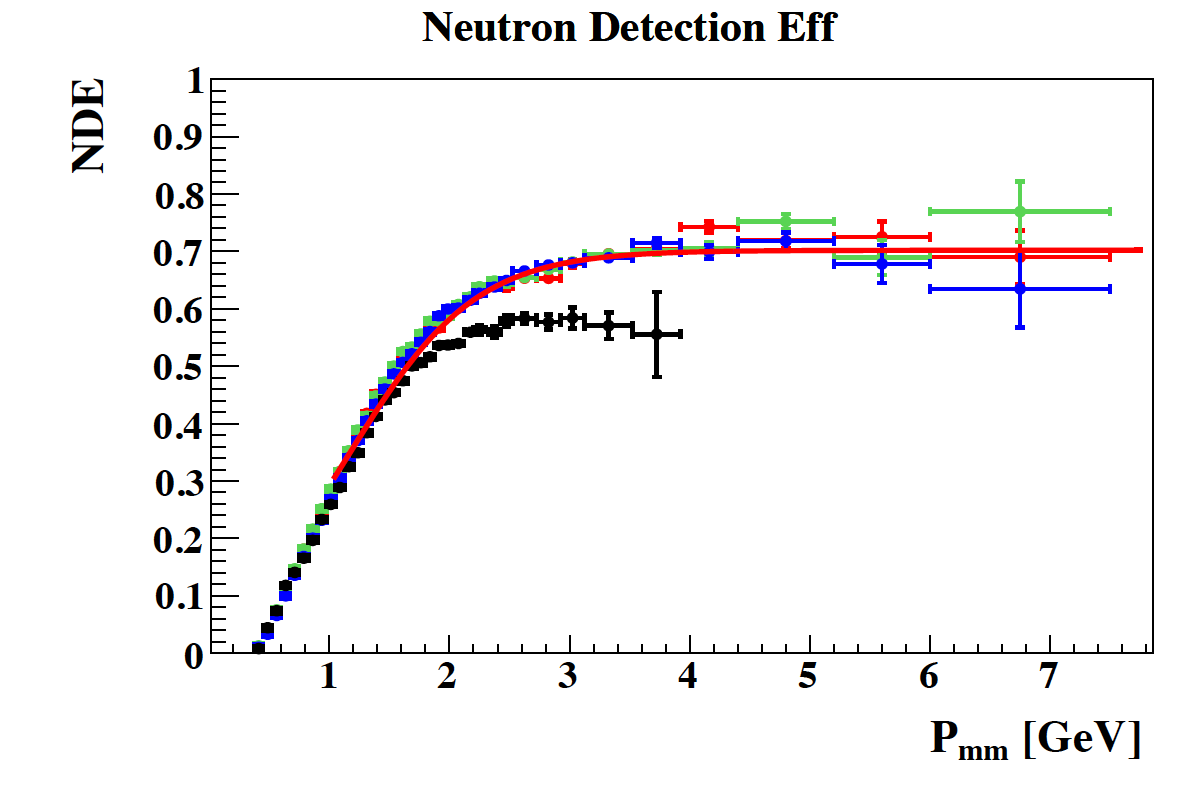
I have a function to fit multiGraph and I would like to show the uncertainties of the fit. I have tried to follow the example of ConfidenceIntervals.C but the band of the uncertainties is not shown (see attached plot). Any help or tips of how I can show the band of the uncertainties from fitting. Also, is there away to show the band within 1 or 2 sigma?
Thanks in advance,
below is a part of my code

mg_eff_1 = TMultiGraph()
mg_eff_1.Add( data_faceIDcut_inb10p6Allbin)
mg_eff_1.Add( data_faceIDcut_inb10p2Allbin)
mg_eff_1.Add( data_faceIDcut_outb10p6Allbin)
mg_eff_1.Add( oldclas6_data)

mg_eff_1.SetTitle('#scale[1.2]{#bf{#font[22]{Neutron Detection Eff}}}; #scale[1.2]{#bf{#font[22]{P_{mm} [GeV]}}} ; #scale[1.2]{#bf{#font[22]{NDE}}}')
mg_eff_1.GetHistogram().SetMaximum(1.0)
mg_eff_1.GetHistogram().SetMinimum(0.0)
mg_eff_1.GetXaxis().SetTitleOffset(1.3);
mg_eff_1.GetXaxis().SetTitleSize(0.05);
mg_eff_1.GetXaxis().SetLabelSize(0.05);
mg_eff_1.GetXaxis().SetLabelFont(22);

mg_eff_1.GetYaxis().SetTitleOffset(1.2);
mg_eff_1.GetYaxis().SetTitleSize(0.05);
mg_eff_1.GetYaxis().SetLabelSize(0.05);
mg_eff_1.GetYaxis().SetLabelFont(22);

label.DrawLatex(0.35, 0.40, caption_oldclas6_data)
label.DrawLatex(0.35, 0.36, caption_data_faceIDcut_inb10p6Allbin)

label.DrawLatex(0.35, 0.32, caption_data_faceIDcut_outb10p6Allbin)
label.DrawLatex(0.35, 0.28, caption_data_faceIDcut_inb10p2Allbin)
mg_eff_1.Draw("AP")
can.Print('{}'.format(mon_out_file_name))

# define fit function
fnde = TF1("fnde","[0]*(1-(1/(1+TMath::Exp(((x-[1])/[2])))))",1.0,7.8)
fnde.SetLineColor(2)
fnde.SetLineWidth(3)
fnde.SetParameter(0, 7.24281e-01)
fnde.SetParameter(1, 7.79712e-01)
fnde.SetParameter(2, 8.02135e-01)
mg_eff_1.Fit('fnde', 'RB')
mg_eff_1.Draw("AP");
ngr2 =36
# grint = TGraphErrors(data_faceIDcut_outb10p6Allbin.GetN())
interval = TGraphErrors(data_faceIDcut_outb10p6Allbin.GetN())
for i in range(0, ngr2):
    # print(i, data_faceIDcut_outb10p6Allbin.GetX()[i])
    interval.SetPoint(i, data_faceIDcut_outb10p6Allbin.GetX()[i], data_faceIDcut_outb10p6Allbin.GetY()[i])
    ROOT.TVirtualFitter.GetFitter().GetConfidenceIntervals(interval, 0.98)
  
interval.SetFillColor(kRed-7)

interval.SetFillStyle(3004);
interval.SetFillColor(kRed)

interval.Draw("e3 same")
mg_eff_1.Draw("AP same");

can.Print('{}'.format(mon_out_file_name))


can.Print('{}]'.format(mon_out_file_name)) 

[


]

Your code cannot be run as it is. It is quite incomplete.
What do you get when you do the single plot:

interval.Draw("A E3");

?

Hi couet,
Thanks for the quick replay. still, the band error is not shown. Attached below is a complete code with text files that are needed to run my code.

fiteff.py (25.6 KB)
validate_nde_tcor_inb10p6_data.txt (2.1 KB)
validate_nde_tcor_inb10p2_data.txt (2.1 KB)
validate_nde_tcor_outb10p6_data.txt (2.1 KB)

Try only:

interval.SetFillColor(kRed-7)

interval.SetFillStyle(3004);
interval.SetFillColor(kRed)

interval.Draw("A E3")

Do no draw mg_eff_1
What do you get ?

here what I got. is it a possible to be too small !!

Yes that’s it. Change the fill style your will see better. These hatches are not the best for a such thin polygon.

Thanks @couet , I wondering if there is a way to show the band error within only the range of fitting. because one I changed the xvalue to create the band as:

clas12_x_bins = sorted([1.4625, 1.5375, 1.6125, 1.6875, 1.7625, 1.8375, 1.9125005, 
                        1.987501, 2.0750005, 2.175, 2.25, 2.375, 2.475, 2.625,
                        2.825, 3.025, 3.325, 3.725, 4.1625, 4.8, 5.6, 6.75, 7, 7.8])

# pmm.append(float(x_val[ii]))
# grint = TGraphErrors(data_faceIDcut_outb10p6Allbin.GetN())
interval = TGraphErrors(data_faceIDcut_outb10p6Allbin.GetN())
for i in range(0, 24):
    interval.SetPoint(i, clas12_x_bins[i], 0)
    # print('interval ', interval)
    ROOT.TVirtualFitter.GetFitter().GetConfidenceIntervals(interval, 0.99)

I end up as what you see in attached

I do not understand how you get this. When I zoom a graph-errors drawn with option 3 the clipping is correct. Can you provide a small reproducer showing this effect? or save the graph in a root file.

attached is a root file for the graph. I am not familiar with the right way to save a graph with error band and below is what I did to save it.

fout = TFile('fiteff.root','recreate')
mg_eff_1.Write("mg_eff_1")
interval.Write("interval")
fout.Close()

fiteff.root (10.6 KB)

I see, it is not a problem of range but a problem of points ordering. The last point of the graph has the lower X value.
do:

 interval->Sort();
 interval->Draw("E3");

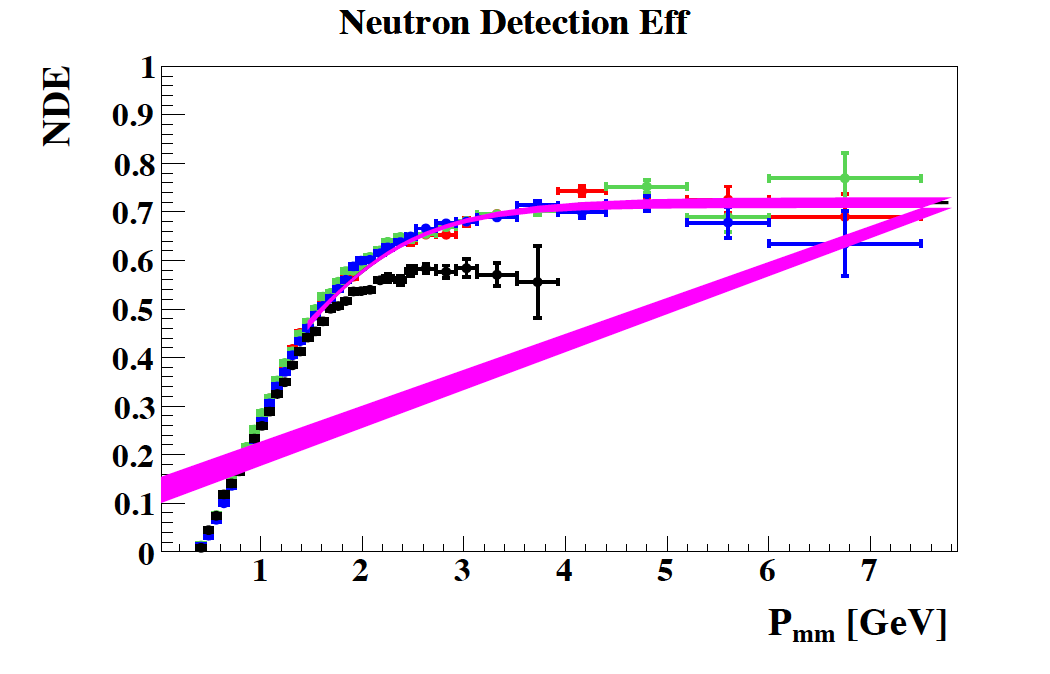
Thank you so much @couet but now I getting the error band below 1.5, how I can remove it? I do not quite understand why if I fit a certain range =[1.5-8], I see the error for fitting in the whole range.

Si it means that points is an extra one. Unwatered. Instead of Sort try Remove

Thank you so much @couet . Now it works. I have just one more question. How I can print the value of the uncertainty from fitting? I would like to show the band as I have drawn it by hand (black) instead of showing it in the curve.

I think the output of the fit should give the information ?
May be @moneta can tell more.

Hi,
for drawing the function confidence bands after fitting, please look at this tutorial:
https://root.cern.ch/doc/master/ConfidenceIntervals_8C.html

Best,

Lorenzo

Hi @moneta ,
yes I followed the example and I already got the band. My question is how I can print the output of the band. I would like to show the band of uncertainty as a black band in the figure (I just drew it by my hand) instead of showing it in the data points (as you see it with kMagenta color)

You can get the band values either as the error of the TGraphErrors grint in the given example, or you can also use directly the function FitResult::GetConfidenceIntervals.

This topic was automatically closed 14 days after the last reply. New replies are no longer allowed.