Empty histogram

Hello everyone
I’m trying to draw three histograms on one Canvas. Unfortunately, the resulting histogram is empty. There are no errors in the console. I checked and the original histograms contain correct data, the X axis is in the same range. The titles of the X and Y axis are the same.
Do you have any advice?
Cheers,
Rafal

#include <TFile.h>
#include <TH1.h>
#include <TCanvas.h>
#include <TLegend.h>
#include <TStyle.h>
#include <iostream>
#include <vector>
#include <TApplication.h>
#include <TKey.h>
#include <TClass.h>

void drawHistograms() {
    // ROOT file list
    std::vector<std::string> fileNames = {
        "Electron1MeV.root", "Electron2MeV.root", "Electron5MeV.root"
    };

    // Histogram names in ROOT files
    std::vector<std::string> histNames = {
        "E e- 1MeV", "E e- 2MeV", "E e- 5MeV"
    };

    // Creating canvas
    TCanvas *c = new TCanvas("c", "Combined Histograms", 800, 600);

    // Colors for histograms
    int colors[] = {kRed, kBlue, kGreen};

    // Loop over files
    for (size_t i = 0; i < fileNames.size(); ++i) {
        // Open ROOT file
        TFile *file = TFile::Open(fileNames[i].c_str());
        if (!file || file->IsZombie()) {
            std::cerr << "Cannot open file: " << fileNames[i] << std::endl;
            continue;
        }

        // Get histogram
        TH1 *hist = dynamic_cast<TH1*>(file->Get(histNames[i].c_str()));
        if (!hist) {
            std::cerr << "Cannot find histogram in file: " << fileNames[i] << std::endl;
            file->Close();
            continue;
        }

        // Set histogram attributes
        hist->SetLineColor(colors[i]);
        hist->SetLineWidth(2);

        // Draw histogram
        if (i == 0) {
            hist->Draw();
            hist->GetXaxis()->SetTitle("The value of the angle in degrees");
            hist->GetYaxis()->SetTitle("Number of Cherenkov photons");
        } else {
            hist->Draw("SAME");
        }

        // Close file
        file->Close();
    }

    // Update canvas
    c->Update();
}

int main(int argc, char **argv) {
    
    TApplication theApp("App", &argc, argv);
    drawHistograms();
    theApp.Run();
    return 0;
}

Add:

        hist->SetDirectory(nullptr); // << --- to detach the histogram from the file

Just before:

        // Draw histogram
        if (i == 0) {

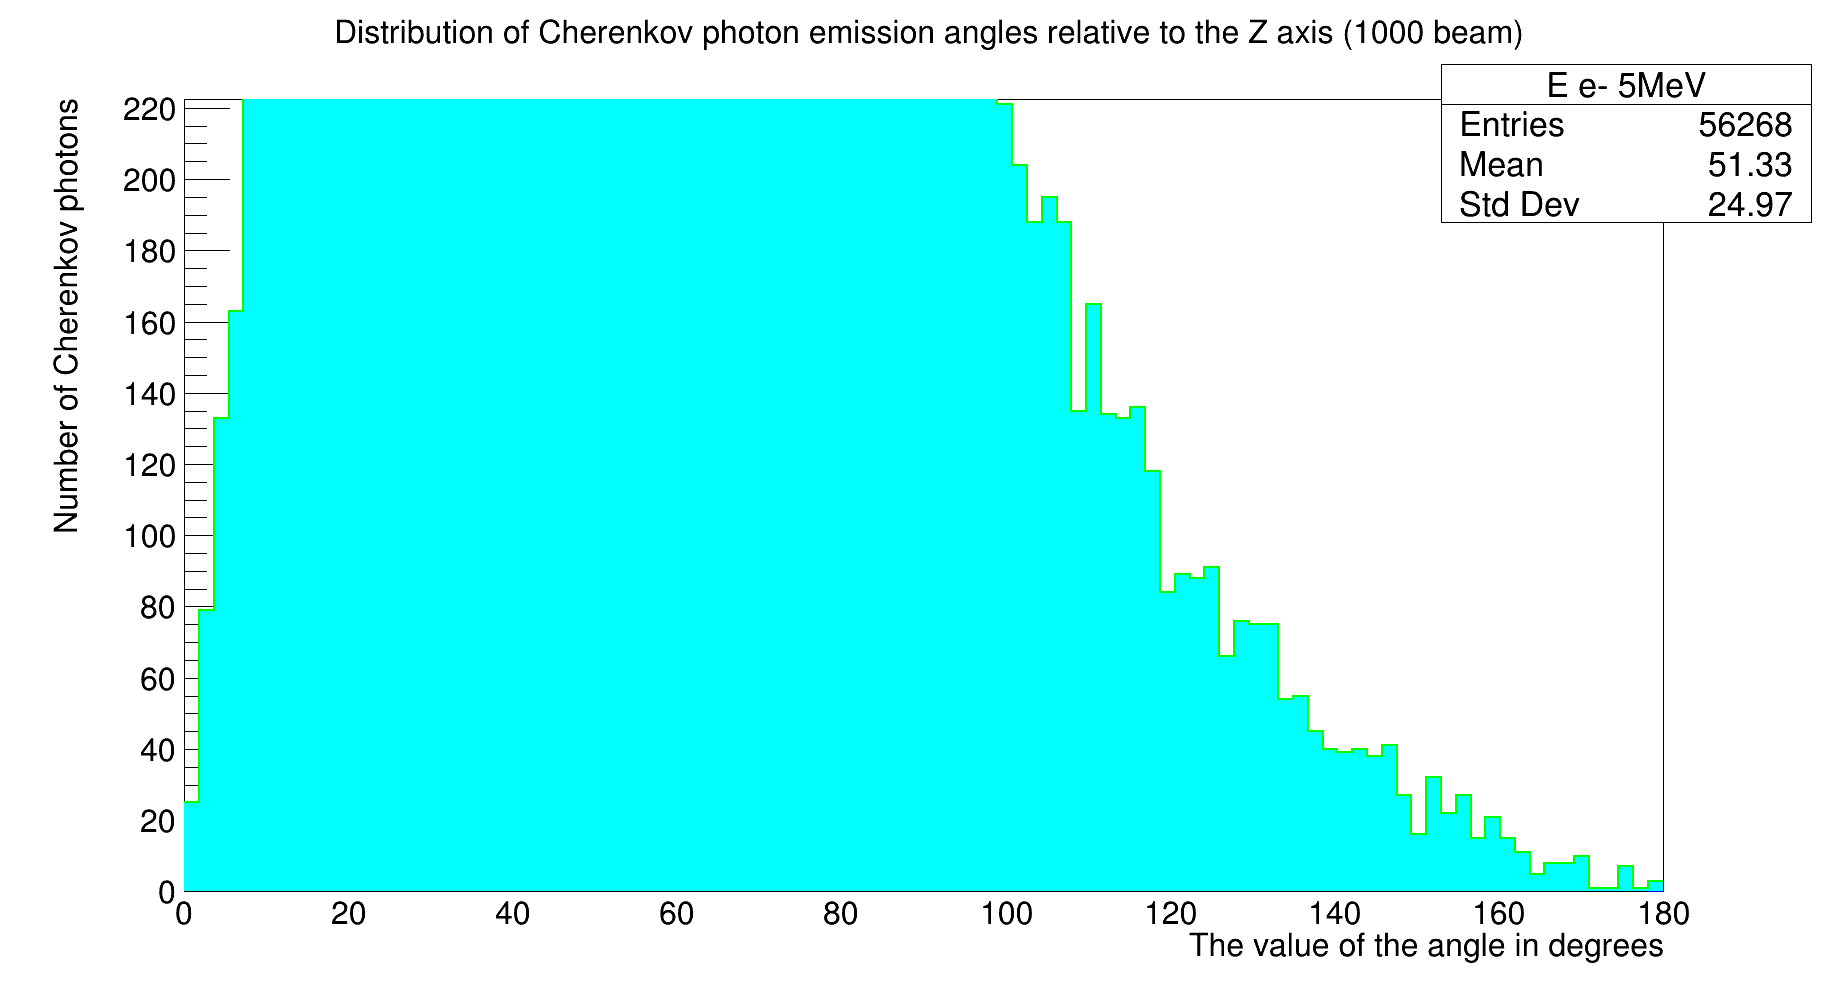
Thank you. I am already drawing, but unfortunately not correctly. Only one histogram from the last loaded file is drawn. The Y axis is filled incorrectly.

I’ll let @couet comment on this

1 Like

Hi,

are you sure that the first two histograms are not drawn “behind” the third one?

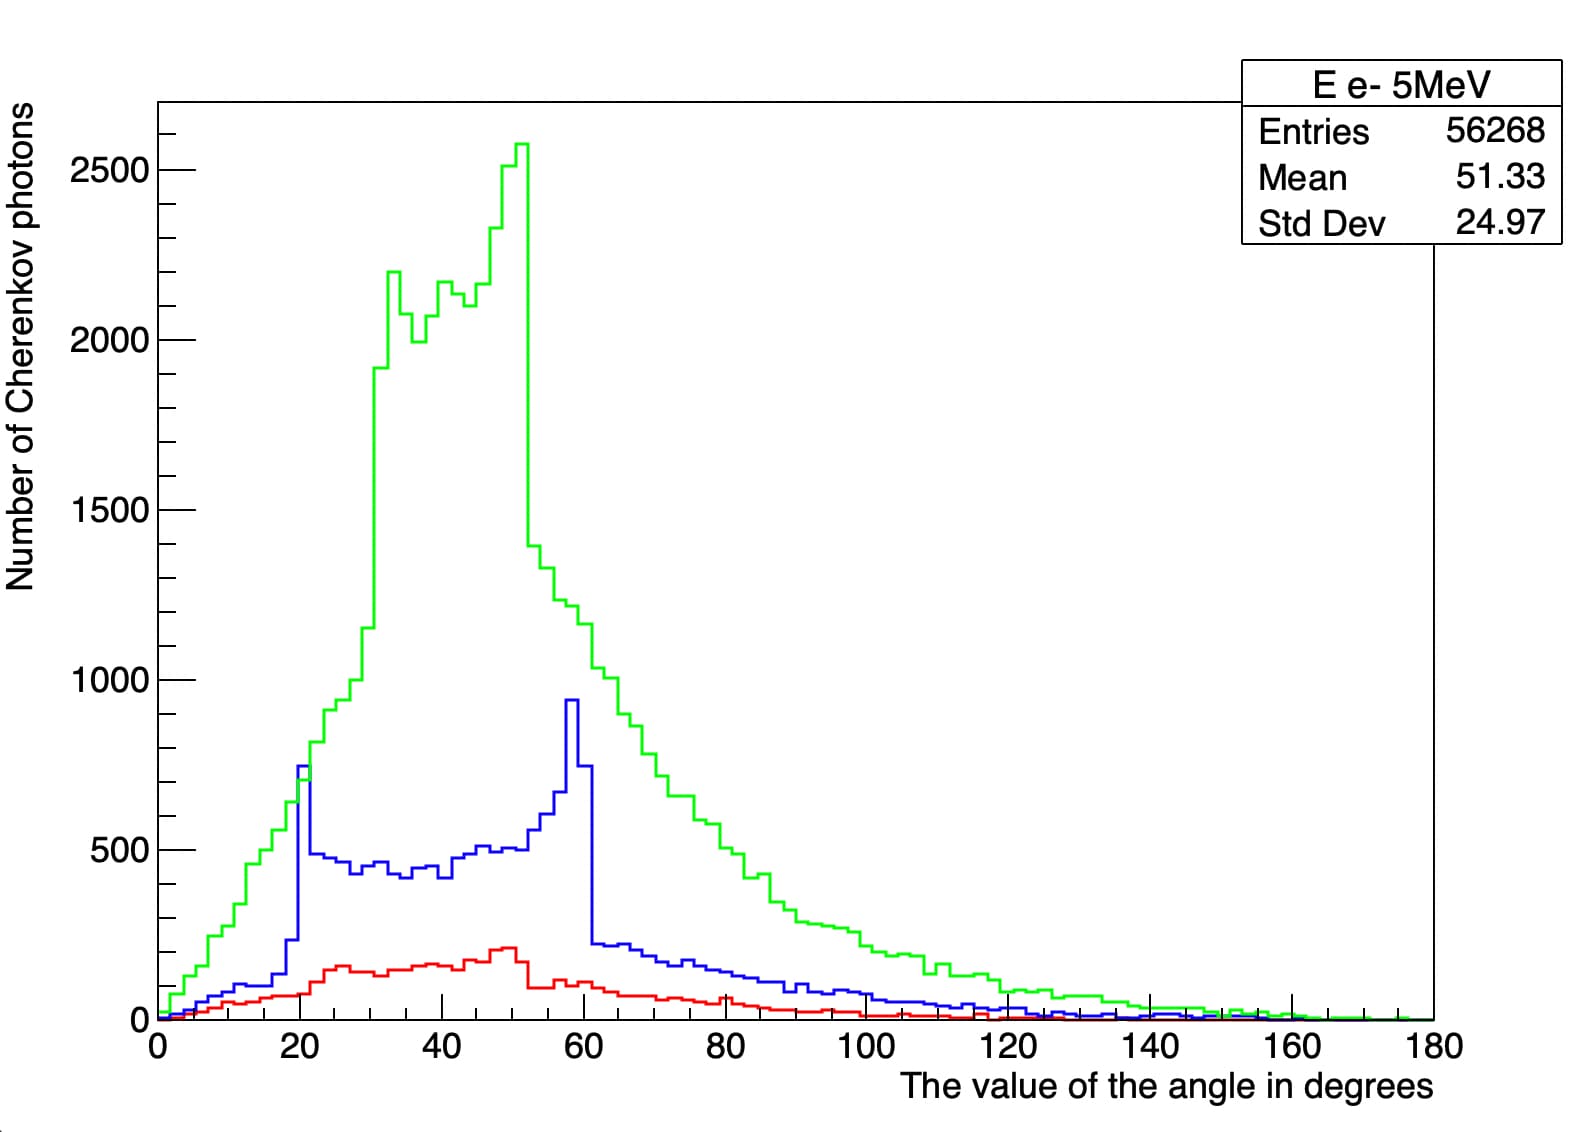
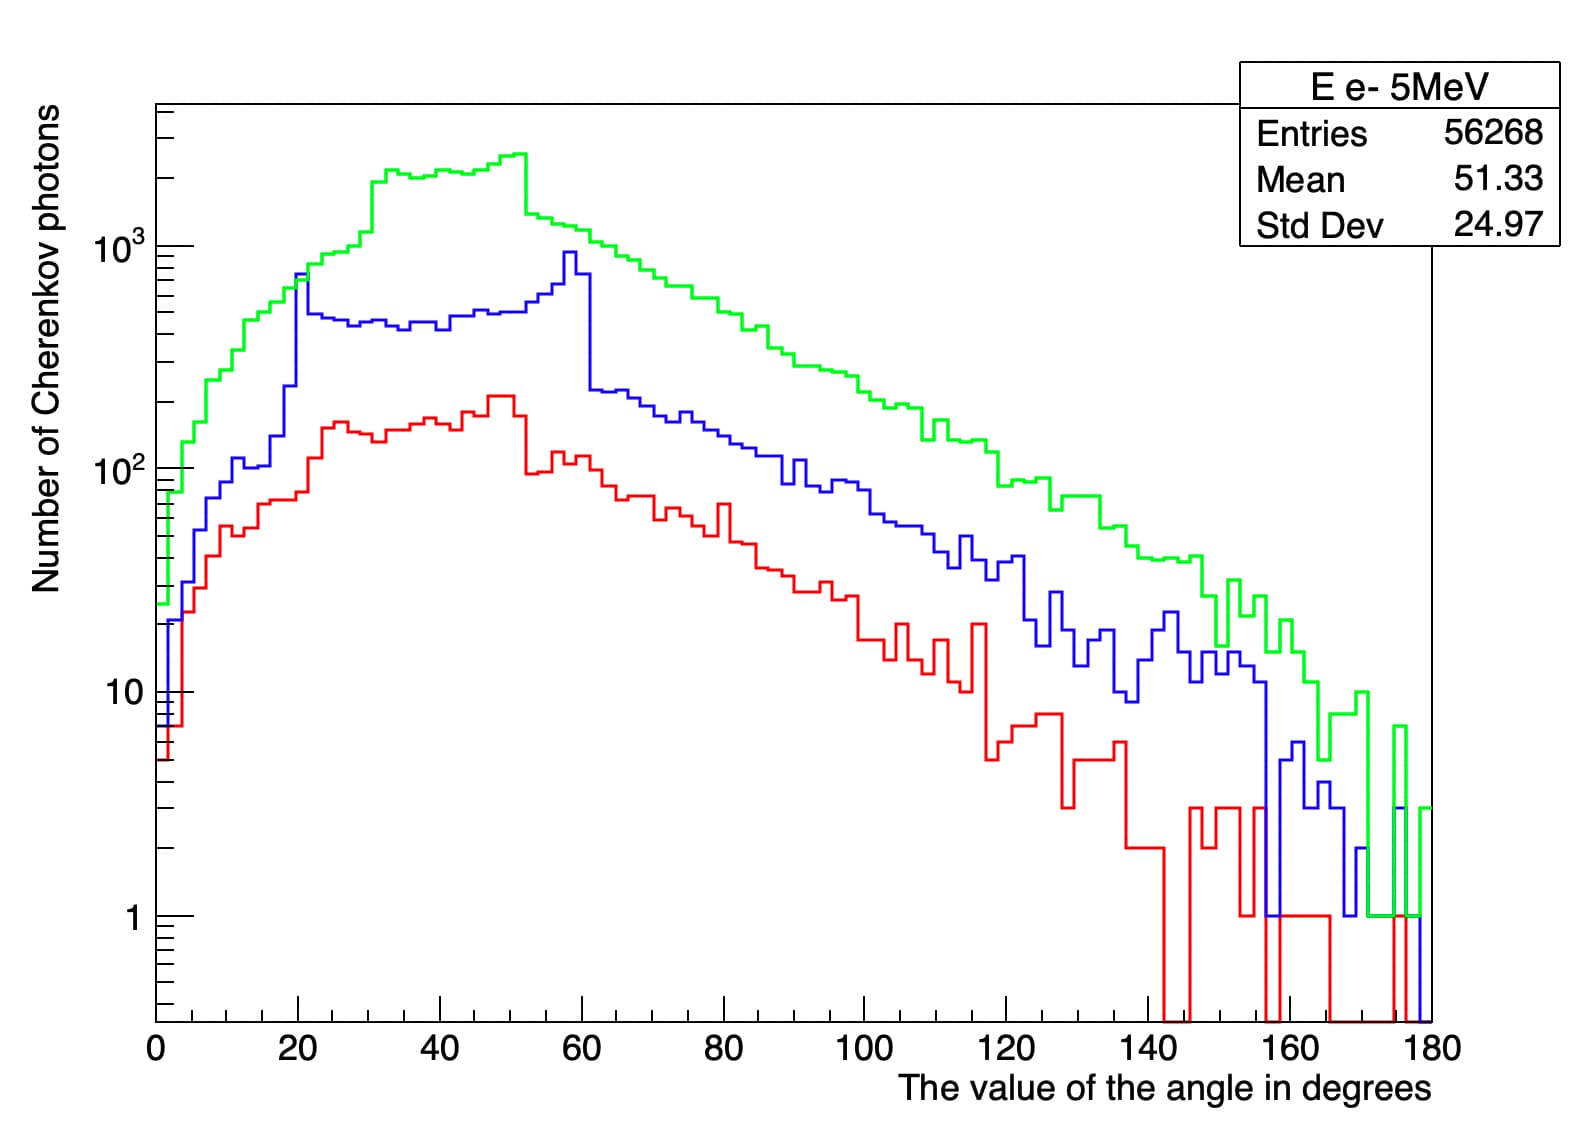
I don’t know that. My goal was to draw three histograms simultaneously on one Canvas to visually compare them. Each energy was supposed to be represented by a different color of the lines.

Do you know where you set this light-blue color the third histogram is filled with?

Can you provide the data file so we can run your example ?

Electron5MeV.root (5.8 KB)
Electron2MeV.root (5.8 KB)
Electron1MeV.root (5.7 KB)

Thank you. My histogram files

Try drawing your histograms in the reverse order, I expect it should make all three to appear.

void drawHistograms() {
   // ROOT file list
   std::vector<std::string> fileNames = {
      "Electron1MeV.root", "Electron2MeV.root", "Electron5MeV.root"
   };

   // Histogram names in ROOT files
   std::vector<std::string> histNames = {
      "E e- 1MeV", "E e- 2MeV", "E e- 5MeV"
   };

   // Creating canvas
   auto c = new TCanvas("c", "Combined Histograms", 800, 600);

   // Colors for histograms
   int colors[] = {kRed, kBlue, kGreen};

   auto st = new THStack();

   // Loop over files
   for (size_t i = 0; i < fileNames.size(); ++i) {
      // Open ROOT file
      TFile *file = TFile::Open(fileNames[i].c_str());
      if (!file || file->IsZombie()) {
         std::cerr << "Cannot open file: " << fileNames[i] << std::endl;
         continue;
      }

      // Get histogram
      TH1 *hist = dynamic_cast<TH1*>(file->Get(histNames[i].c_str()));
      hist->SetDirectory(nullptr);
      if (!hist) {
         std::cerr << "Cannot find histogram in file: " << fileNames[i] << std::endl;
         file->Close();
         continue;
      }

      // Set histogram attributes
      hist->SetLineColor(colors[i]);
      hist->SetFillStyle(0);
      hist->SetLineWidth(3);

      st->Add(hist);

      // Close file
      file->Close();
   }

   st->Draw("nostack");
   st->GetXaxis()->SetTitle("The value of the angle in degrees");
   st->GetYaxis()->SetTitle("Number of Cherenkov photons");
   c->Modified();
   c->Update();
}

2 Likes

In that particular case log scale along the Y axis might be better:

1 Like

Thank you very much. You are very helpful!
If I understand correctly, the first histogram is drawn on the Canvas first, then the second, and finally the third? That is why only the legend of the third histogram is visible because the third one has covered the previous ones?
Cheers,
Rafal

Yes and yes :slight_smile:

1 Like

Yes, that’s why I recommend to us a THStack because you do not need to take care of the order… The whole range will be computed automatically

1 Like