ROOT Version: 6.18/04
Platform: Arch Linux-64 bit
Compiler: linuxx8664gcc
Hello everyone, I am measuring the Compton effect using a Cs137 Source and NaI detectors. The output of the data consists of multiple “.dat” files with four columns of data. The column I am interested in is the third column where the “channel” is listed. I essentially want to plot a histogram of the frequency of the channels and use this histogram to calibrate my experiment, i.e find out that channel number 12000 refers to 662keV, and channel 2000 refers to 32keV, etc.
I have 20 of these “.dat” files and have previously used this quick/dirty method in RInt:
tr = TTree("tr", "title");
tr.ReadFile("filename","a:b:c:d");
tr.Draw("c>>hist(bins,0,maxchannel)");
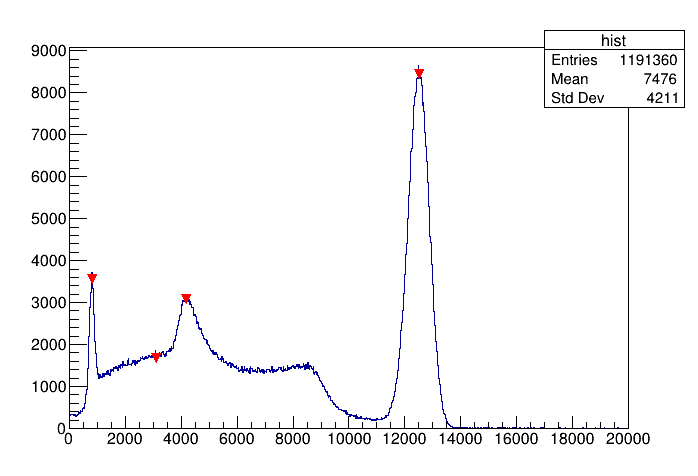
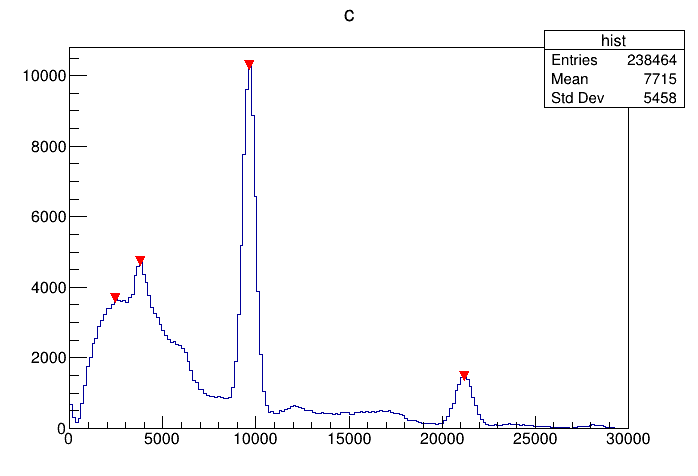
What I get is a Histogram, but not only is this tedious to repeat for 20 or so files, but I can’t figure out how to label specific peaks in my data, for calibration purposes. I can however right click on the histogram and select the ShowPeaks option in the GUI Plotter.
My questions are:
- Is there a standard way in ROOT to load all of the files in a certain directory into ROOT and plot them as histograms? (In Python I would just do a forloop with plt.hist(), but I am not sure how I would achieve the same effect in ROOT).
- Is there a way to label and display the specific bin/channel peak observed in the histogram?
Here is an example of what I am plotting individually now.
Thank you,
Myles