Hello again,
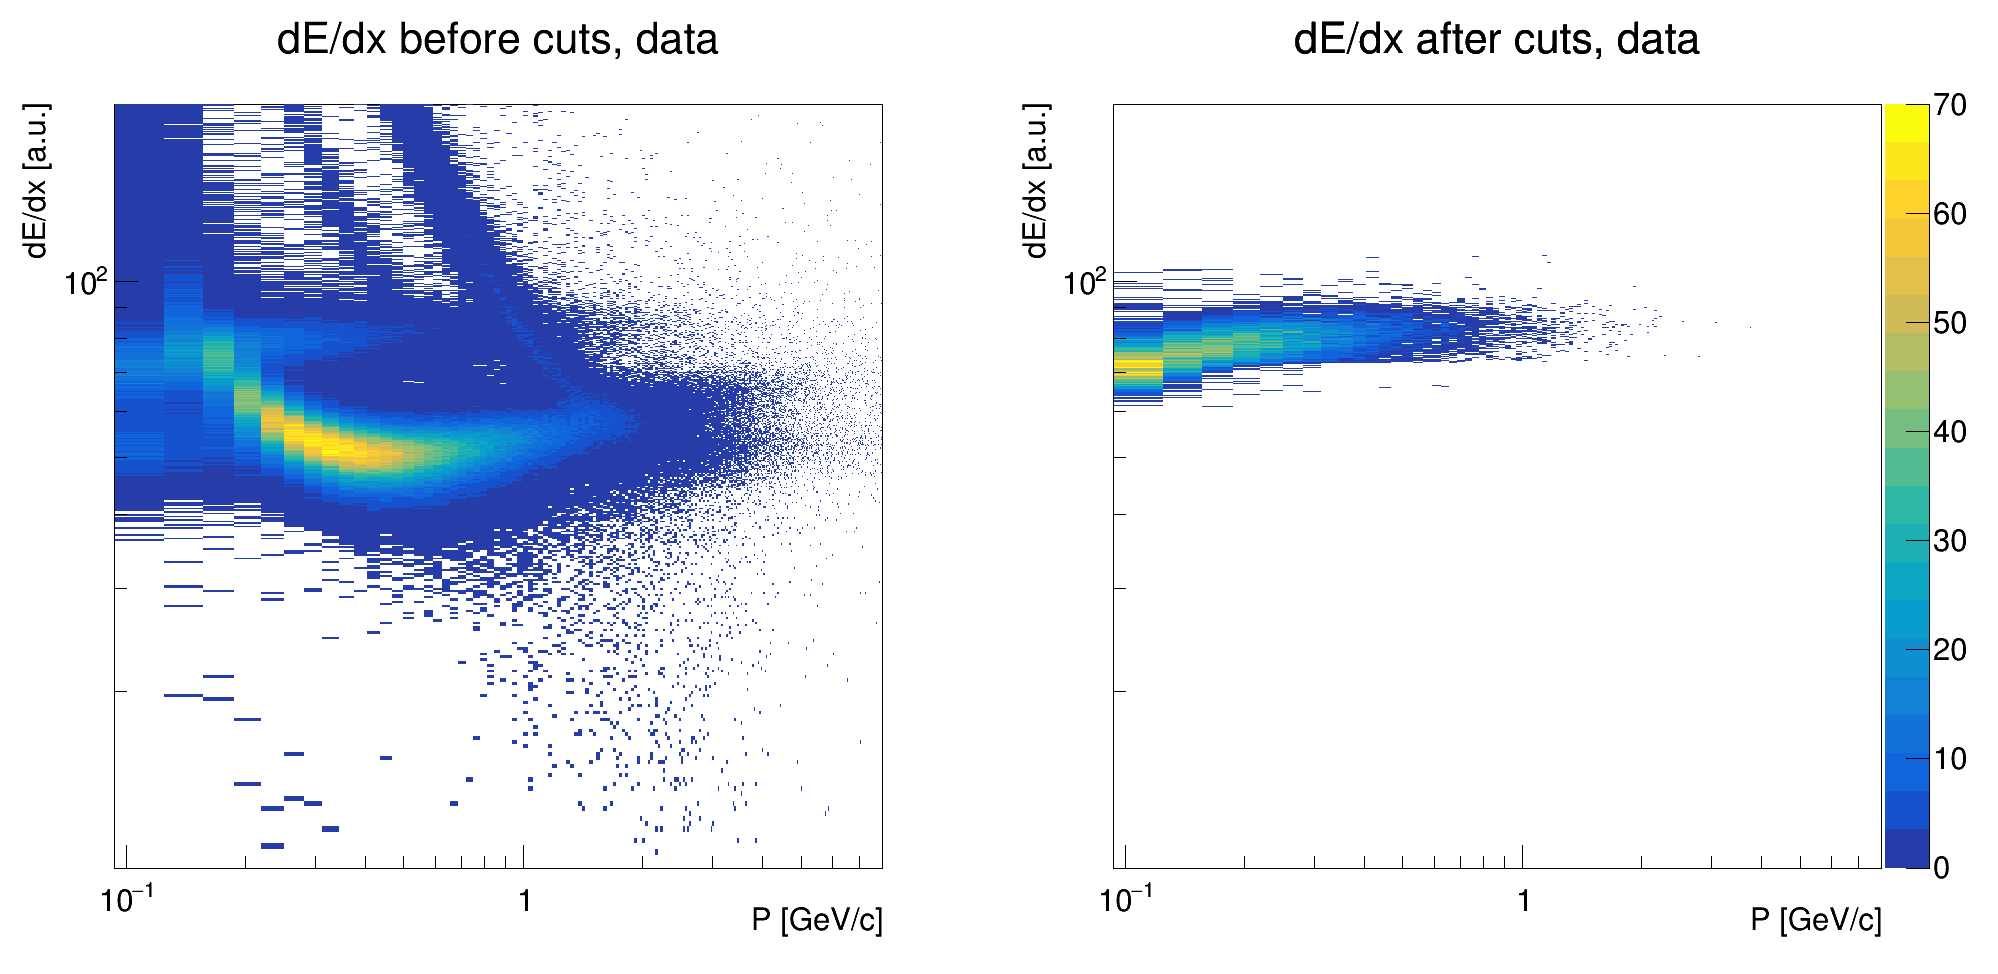
I am trying to plot a TH2F histogram. When I plot the X Axis logarithmically the first couple of bins look streched out
any easy fixes that do not require to rebin the whole thing (Thats would be really painfull)
with best regards, Nikita
Yes, that’s how log scale works. Low ranges are “zoomed”.
You could also plot log(P) instead of P, i.e. h2->Fill(log(P), log(dE)), that way your plot would be directly in logarithmic axis and all the bins would have (visually) the same width.