E2 draw option not working

I am stumped by a problem I’m having trying to get the E2 option to work with histograms I am drawing. I am using OSX High Sierra (10.13.3), root v6.12.04.

In none of my root code or macros does the E2 option work in drawing a histogram. Nothing shows up on my canvas. The other draw options work fine, showing histos, markers with error bars, etc. For instance, both E3 and E4 options work as expected. Here is a bit of code as an example.

#include "Rtypes.h"
#include "TFile.h"
#include "TLatex.h"
#include "TGraph.h"
#include "TAxis.h"
#include "TH1.h"
#include "TPad.h"
#include "TCanvas.h"
#include "TFrame.h"
#include "TLegend.h"
#include "TLegendEntry.h"
#include "TMultiGraph.h"
#include "TLegendEntry.h"

void test() {

   TCanvas *c1 = new TCanvas("c1","SR plots",800,600);
   
   TFile histoSRGGM("ntupleAnalysis/Hist-SRGGM.root");

   TH1F* histomGGM;
   histomGGM = (TH1F*)histoSRGGM.Get("m");
   TH1F* historGGM;
   historGGM = (TH1F*)histoSRGGM.Get("r");
   TH1F* histoleadPtGGM;
   histoleadPtGGM = (TH1F*)histoSRGGM.Get("leadPt");
   TH1F* histosubPtGGM;
   histosubPtGGM = (TH1F*)histoSRGGM.Get("subPt");

   float titleSize(20.0);
   
   histomGGM->SetMaximum(5.0);
   historGGM->SetMaximum(15.0);
   histoleadPtGGM->SetMaximum(10.0);
   histosubPtGGM->SetMaximum(25.0);

   histomGGM->GetYaxis()->SetNdivisions(505);
   histomGGM->GetYaxis()->SetNdivisions(505);

   histomGGM->SetMarkerSize(0);
   histomGGM->SetFillStyle(3001);
   histomGGM->SetFillColor(12);
   //histomGGM->SetMarkerColor(2);
   historGGM->SetMarkerStyle(21);
   historGGM->SetMarkerColor(2);
   histoleadPtGGM->SetMarkerStyle(21);
   histoleadPtGGM->SetMarkerColor(2);
   histosubPtGGM->SetMarkerStyle(21);
   histosubPtGGM->SetMarkerColor(2);
   
   histomGGM->Draw("E2");
   
   c1->Print("test.pdf");
  
}

To run your macro we need the file Hist-SRGGM.root

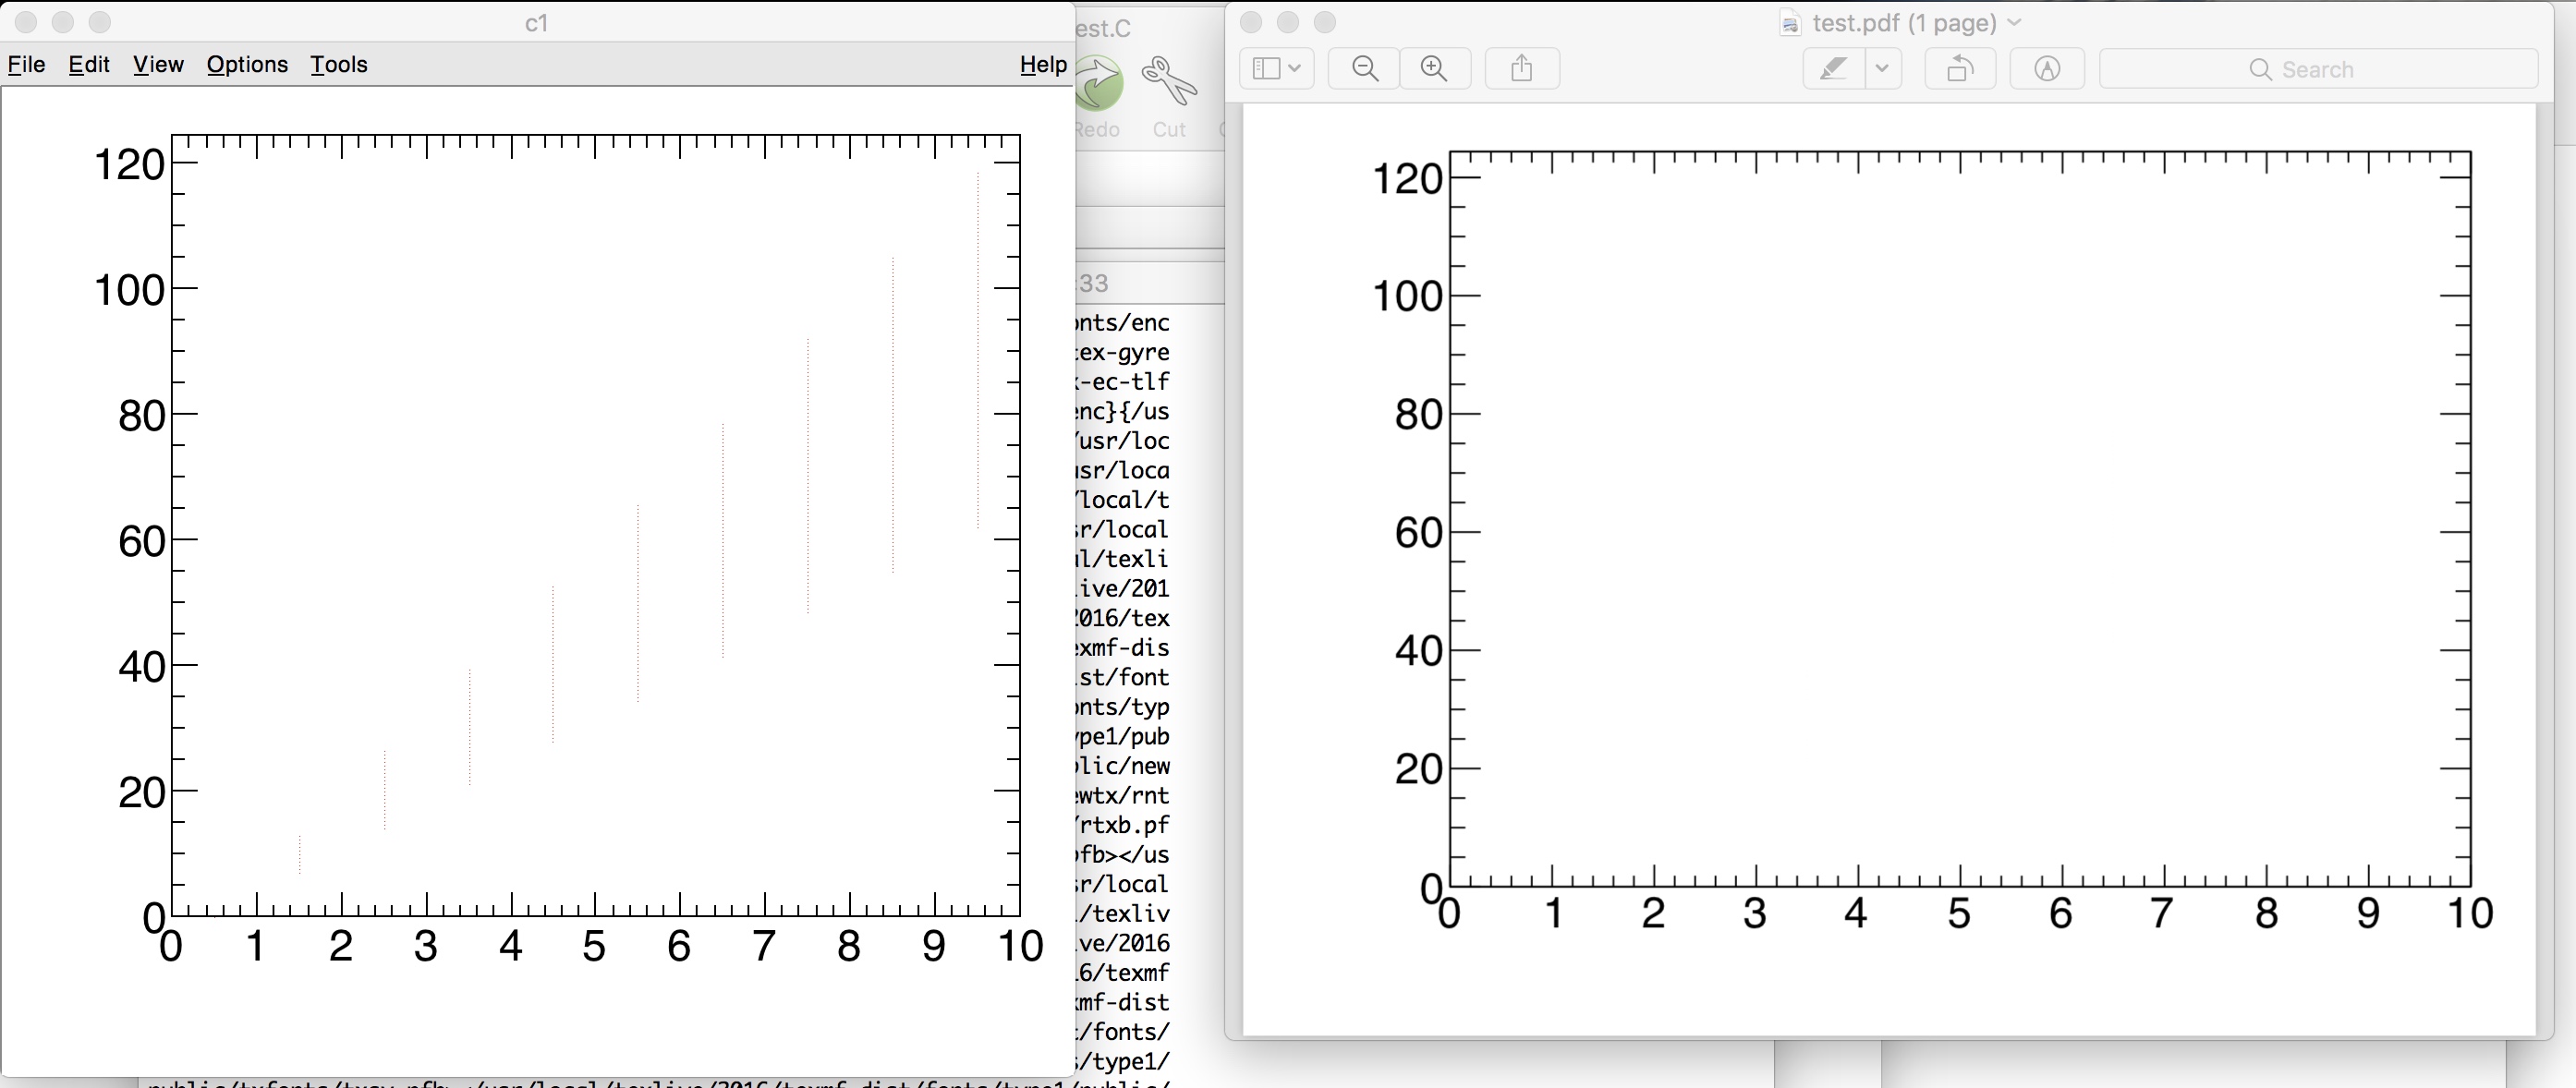
I can’t share that histo file, as it turns out. So, how about this instead (for the problem I’m seeing, it doesn’t seem to matter where the histo comes from, how it is made, etc.). I will note that what I see on the canvas does not correspond to what I see in the pdf file that is written (a secondary problem). On the canvas I see vertical error bars with light shading. In the pdf file, nothing shows up within the plot.

#include "Rtypes.h"
#include "TFile.h"
#include "TLatex.h"
#include "TGraph.h"
#include "TAxis.h"
#include "TH1.h"
#include "TPad.h"
#include "TCanvas.h"
#include "TFrame.h"
#include "TLegend.h"
#include "TLegendEntry.h"
#include "TMultiGraph.h"
#include "TLegendEntry.h"

void test() {

   TCanvas *c1 = new TCanvas("c1","SR plots",800,600);
   
   /*TFile histoSRGGM("ntupleAnalysis/Hist-SRGGM.root");

   TH1F* histomGGM;
   histomGGM = (TH1F*)histoSRGGM.Get("m");*/

   TH1F* histomGGM = new TH1F("histomGGM","histomGGM",10,0.,10.);
   histomGGM->Sumw2();
   for(int i = 0; i <= 10; i++) {
     for(int j = 1; j <= 10; j++) histomGGM->Fill(i,1.0);
   }

   float titleSize(20.0);
   
   histomGGM->SetMaximum(20.0);
 
   histomGGM->GetYaxis()->SetNdivisions(505);
   histomGGM->GetYaxis()->SetNdivisions(505);

   histomGGM->SetMarkerSize(0);
   histomGGM->SetFillStyle(3001);
   histomGGM->SetFillColor(12);
   //histomGGM->SetMarkerColor(2);
   
   histomGGM->Draw("E2");
   
   c1->Print("test.pdf");

   
}

I simplified a bit your demonstrator:

{
   auto c1 = new TCanvas("c1","c1",800,600);
   auto h = new TH1F("h","h",10,0.,10.);

   for (int i = 0; i <= 10; i++) {
     for( int j = 1; j <= 10; j++) h->Fill(i,(double)i);
   }

   h->SetMarkerSize(0.);
   h->SetFillStyle(3003);
   h->SetMarkerColor(kRed);
   h->SetFillColor(kRed);

   h->Draw("E2");
   c1->Print("test.pdf");
}

it gives me the following picture on Mac with ROOT 6.12. On the left the pdf on the right the canvas.

Interesting. I see the following, running your demonstrator.

I now suspect something in my .rootlogon.C is creating the problem. It loads what are supposed to be necessary ATLAS styles. I will try without that. That would be an unfortunate source of the problem, as generally I need to run the style macro for ATLAS plots.

{
// Load ATLAS style
gROOT->LoadMacro(“AtlasStyle.C”);
SetAtlasStyle();
}

Running the ATLAS style macro, SetAtlasStyle(), was indeed the culprit. It’s probably turning off horizontal error bars somewhere?

May be … I do not know in details …

For closure: yes, SetAtlasStyle() was the problem. Within it there is a gStyle->SetErrorX(0.0001) command.

This topic was automatically closed 14 days after the last reply. New replies are no longer allowed.