I write because I would like to draw several datasets in the same QQTGraph. I have tried and the results is not satisfactory, as you can see in the image attached. qqplotboth.pdf (23.3 KB)
I would like to plot the two datasets respect to the same theoretical line. The way I have done this is just create two QQTGraphs and then plot them in the same canvas. How could I plot the two datasets respect to the same theoretical like? (I may need to plot a third dataset too)
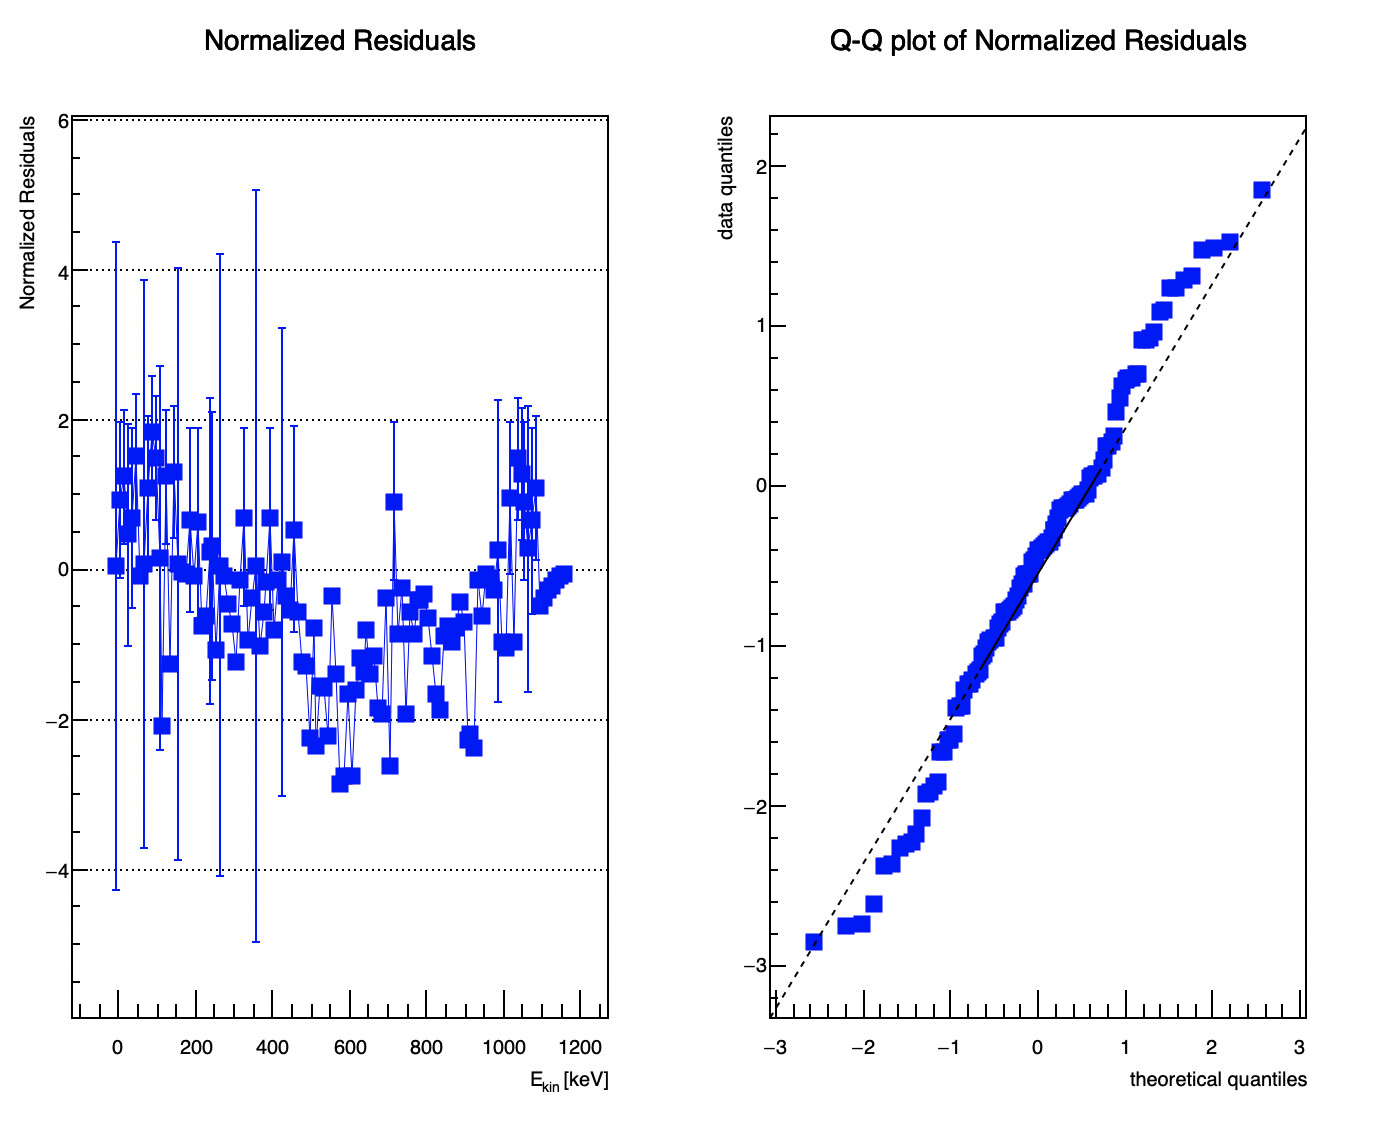
This macro basically do a chi2test and save the plot of the residuals and the QQ plot in a root file. Then, I run this macro for different data and I obtain the root file with the two QQ plots, and from the console I plotted them in the same canvas…
The bs_h_q1 is always the histogram that I compare with the other three, so at the end there are 3 chi2test. The macro I sent have the option to store the plots in another root file commented, so It just plot the graphs. Just so you know it!