Drawing the band for the error bar


Hi experts in ROOT family,
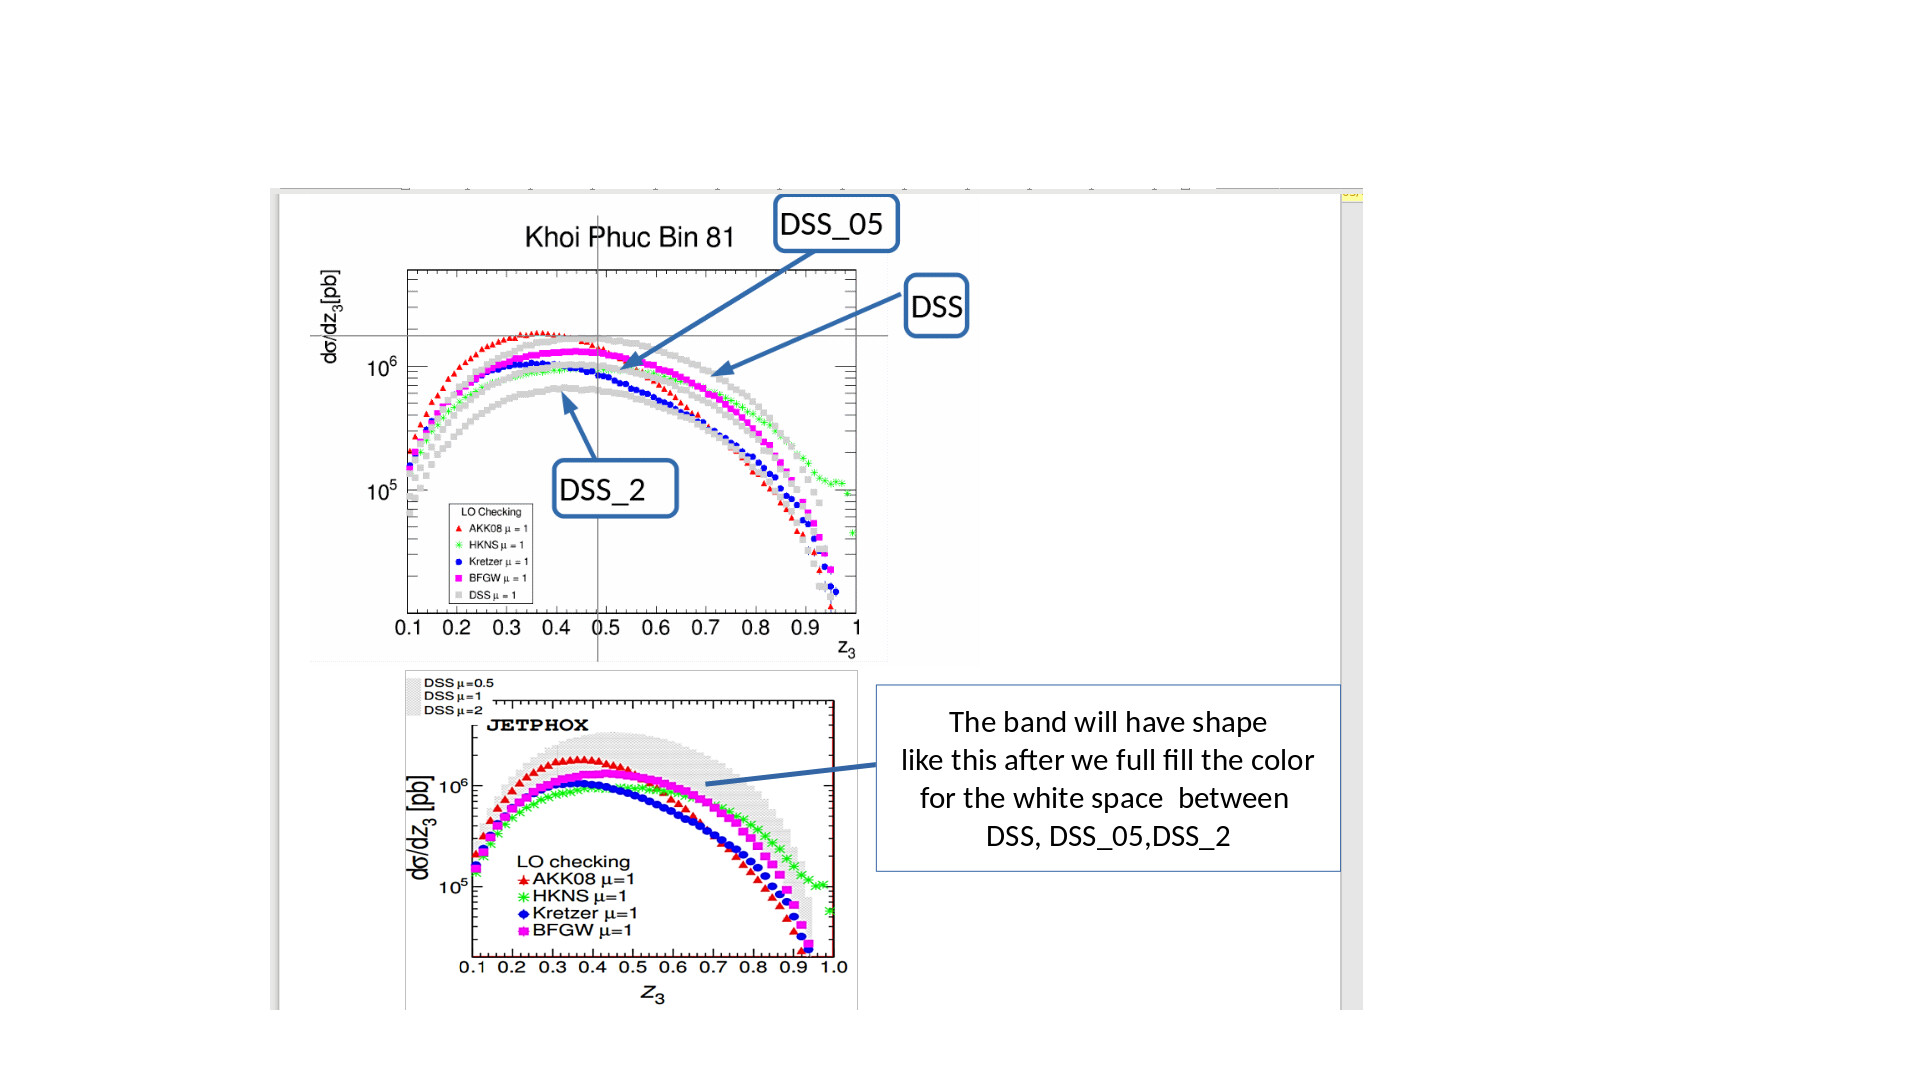
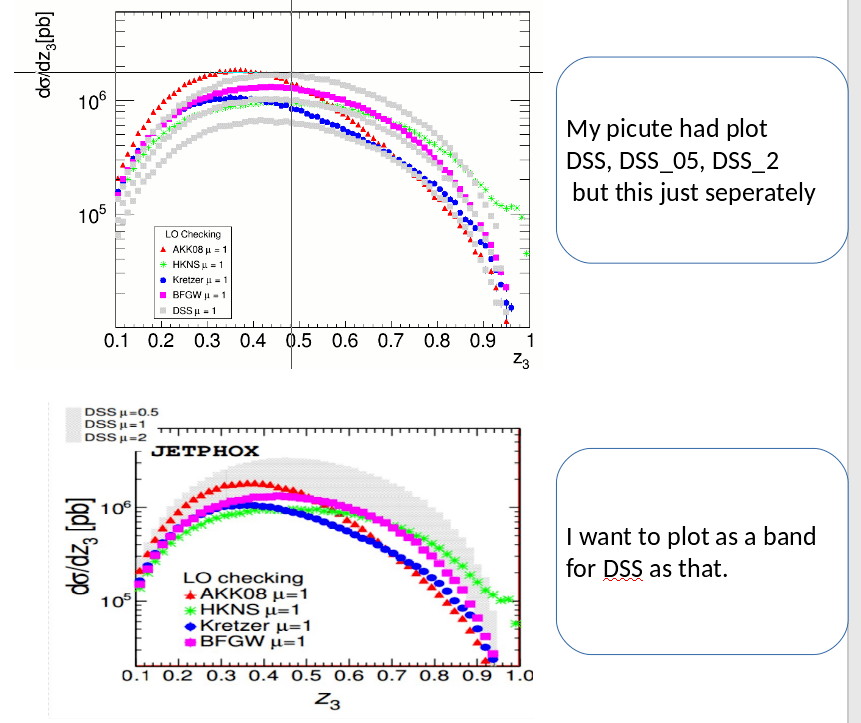
I want to draw a band for the error bar which contain 3 root file in the same pad. Particularly, I had 7 files root AKK08, Kretzer, BFGW, HKNS, DSS, DSS_05 and DSS_2 and ploted them seperately in the same Canvas (My picture attached below with above position, DSS is kGray).

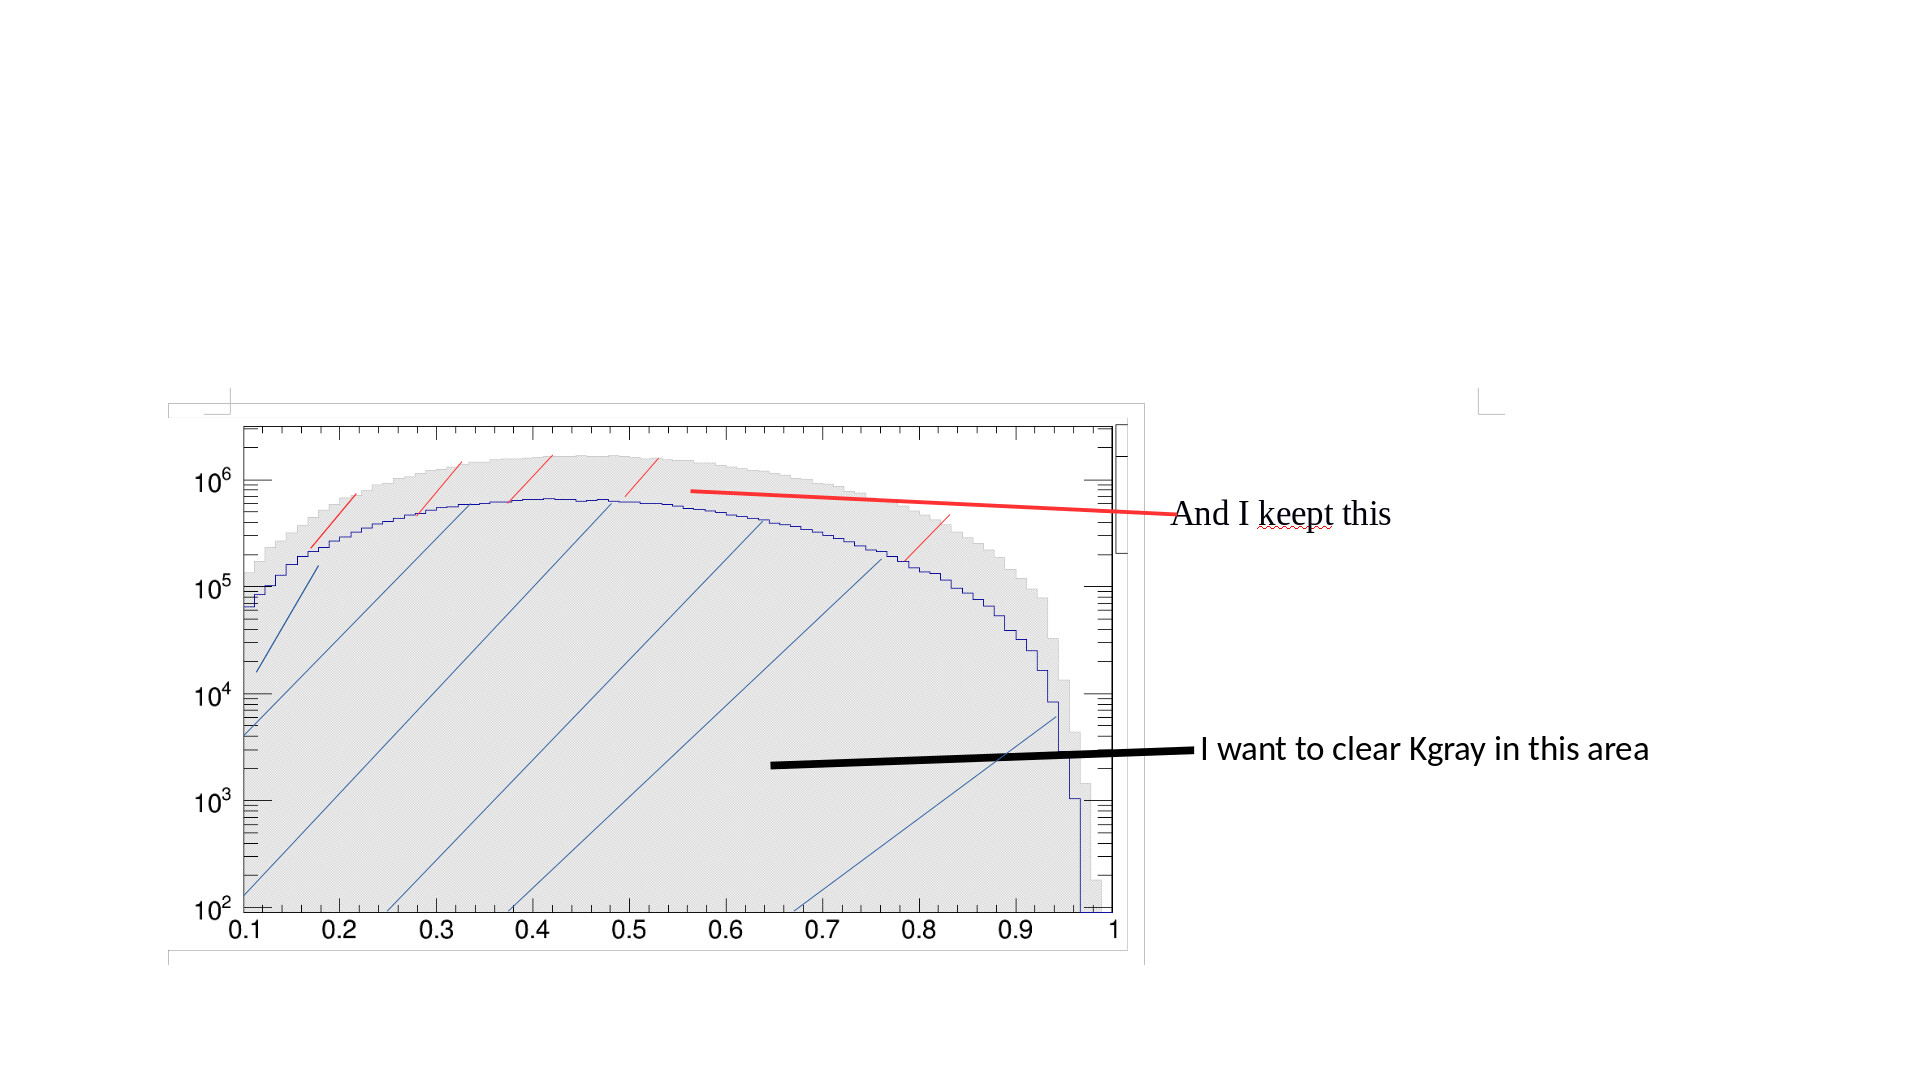
Now, I’m dont know how to plot 3 file DSS, DSS_05 and DSS_2 nearly as the band continuously in the same pad.(Picture attached under and I’m trying to do as that).

My histogram is TH1D.
My code:

    TFile *fa = new TFile("ggotest_lo_9AKK08.root");
    TH1D *hza = new TH1D("hza", "Khoi Phuc Bin 9", bin_z, z_min, z_max);
...
	TFile *fh = new TFile("ggotest_lo_9HKNS.root");
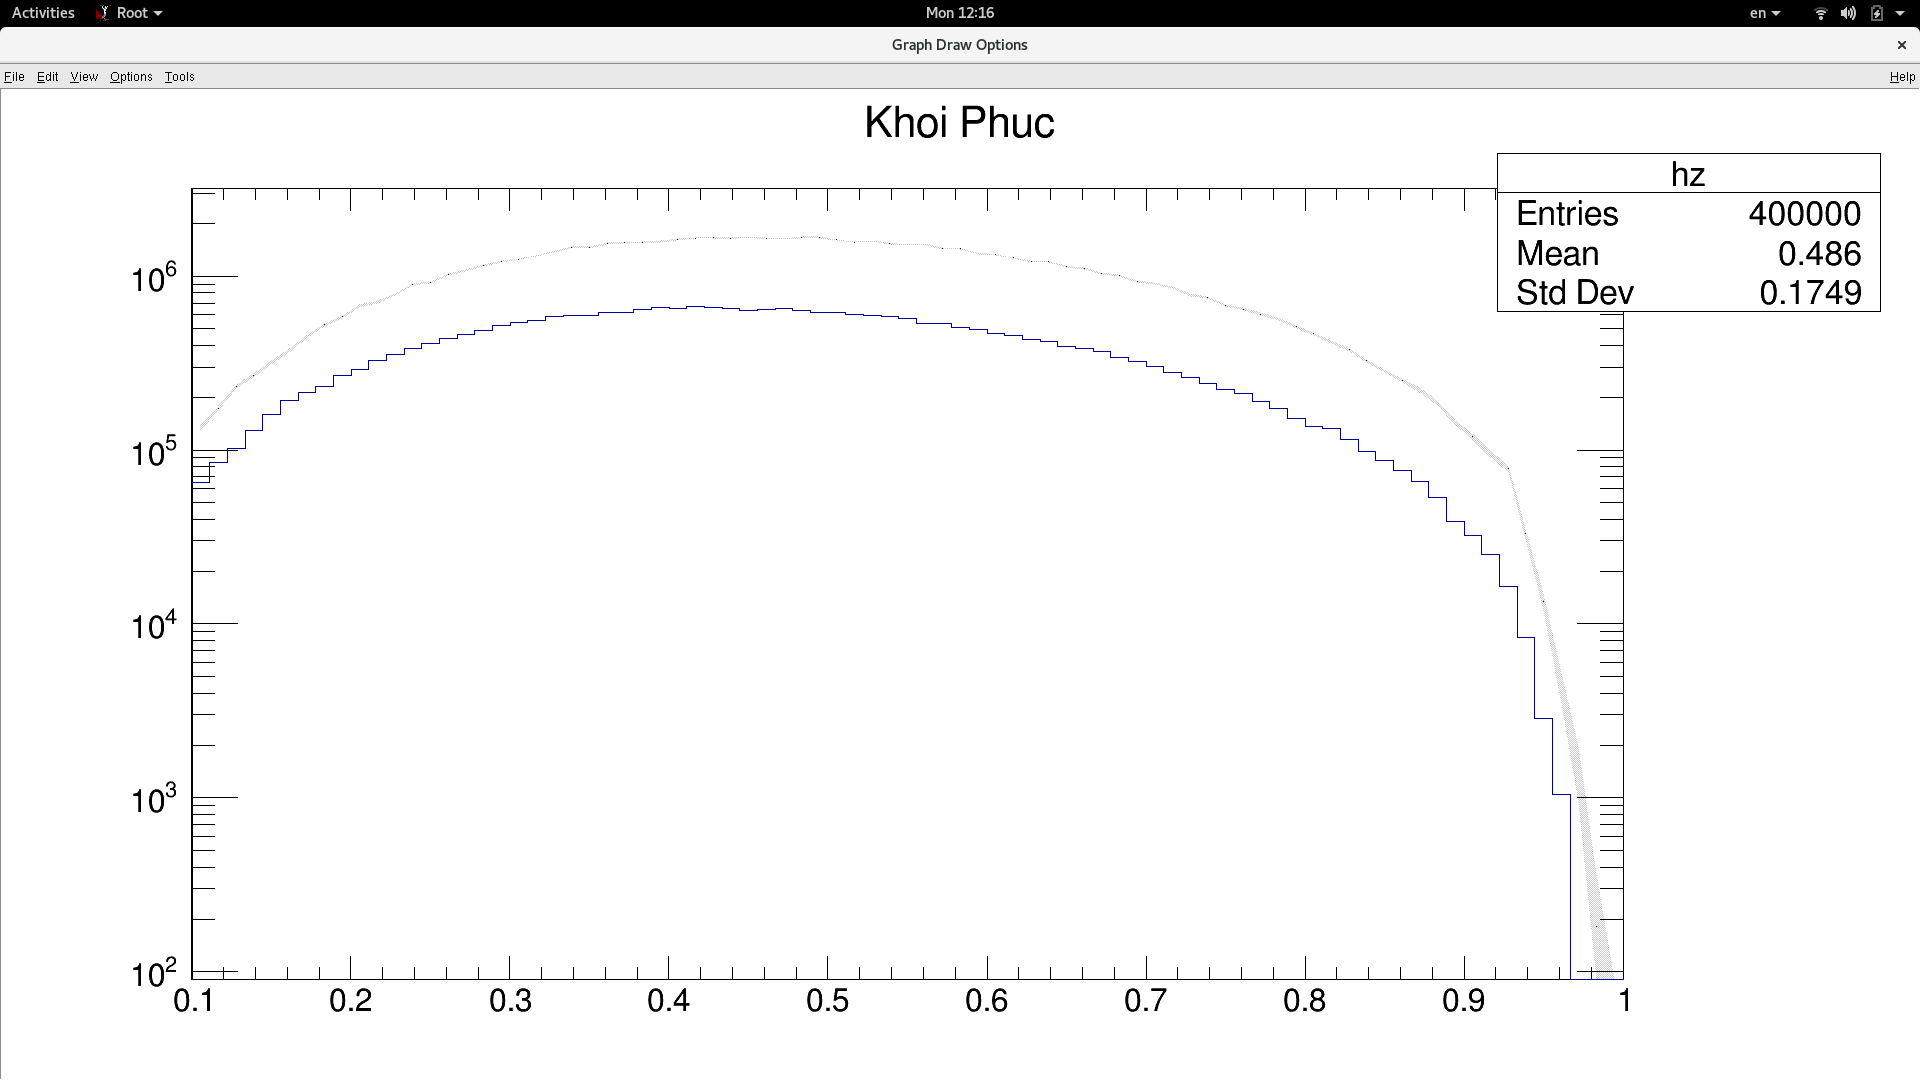
	TH1D *hzh = new TH1D("hz", "Khoi Phuc", bin_z, z_min, z_max);

	TFile *fk = new TFile("ggotest_lo_9Kretzer.root");
	TH1D *hzk = new TH1D("hz","Khoi Phuc", bin_z, z_min, z_max);
	

	TFile *fb = new TFile("ggotest_lo_9BFGW.root");
	TH1D *hzb = new TH1D("hz", "Khoi Phuc", bin_z, z_min, z_max);


	TFile *fd05 = new TFile("ggotest_lo_9DSS_05.root");
	TH1D *hzd05 = new TH1D("hz","Khoi Phuc",bin_z, z_min, z_max);
    hzd05->SetMarkerStyle(21);
	hzd05->SetMarkerColor(kGray);
	hzd05->SetMarkerSize(1.3);
	
	TFile *fd = new TFile("ggotest_lo_9DSS.root");
	TH1D *hzd = new TH1D("hz","Khoi Phuc",bin_z, z_min, z_max);
	hzd->SetMarkerStyle(21);
	hzd->SetMarkerColor(kGray);
	hzd->SetMarkerSize(1.3);

	TFile *fd2 = new TFile("ggotest_lo_9DSS_2.root");
	TH1D *hzd2 = new TH1D("hz","Khoi Phuc",bin_z, z_min, z_max);
        hzd2->SetMarkerStyle(21);
	hzd2->SetMarkerColor(kGray);
	hzd2->SetMarkerSize(1.3);

	
	TCanvas *c1 = new TCanvas("c1","Graph Draw Options",205,47,600,400);

	c1->SetLogy();
	c1->SetTickx();	
	c1->SetTicky();		
	hza->GetXaxis()->SetTitle("z_{3}");
	hza->GetYaxis()->SetTitle("d#sigma/dz_{3}[pb]");
	
	hza->Draw("E");
	
	
	hzh->Draw("E same");
	hzk->Draw("E same");
	hzb->Draw("E same");
	hzd05->Draw("E same");
	hzd->Draw("E same");
	
	hzd2->Draw("E same");


Honestly speaking, I have researched about 1 month but still not find the solution. So ideas or suggestions are highly appreciated.
Hopping admin accept my post!

Best regard,
Zane

_ROOT Version:_6.10/08
Platform: Fedora version 25
Compiler: gcc 5.3


How the band is formed ? that’s the errors of your histogram ?

Dear couet,

Thanks for your reply!

The band is formed by connect 3 line kGray DSS_05, DSS and DSS_2 . As you can see in tbelow picture, the white space between 3 this arguments still not full fill kGray color. So, my task that is how I can to connect DSS, DSS_2, DSS_05 without white space, then we fill color kGray for them and then the band will be established.

The error my team has already caculated. So now we need draw the band as my discuss above.

I’m extremely willingness to listen your ideas.:smiling_face_with_three_hearts:

Best regard,
Zane

The option E3 allows to draw errors as bands.

Dear couet,

Thanks for your reply!

I was apply option E3 as your suggestion, but the band not like as I expect.
Then, I found Color on error bands on TH1 histogram, it’s resemble my case.

I modified my code and plot again. Now, I want to clear kGray color area below the blue line. How can I do that?
My code here:
Checking.C (367 Bytes)

Best regard,
Zane(upload://hCgNLIPNnYrjfVPHKV8X0QWk0mL.C) (367 Bytes)

Hi couet,

This is the result when I used option “E3” in attached picture. I also changed other option “E4” but the outcomes don’t like I wish.

Thanks
Zane

I guess you need to use a TGraphAsymmErrors
ROOT: TGraphPainter Class Reference
with DSS as the data points, and DSS_2 and DSS_05 as low and high y-errors (and zero errors in x), then draw the graph with “a3” or “a4” (see same page above).

void Checking(){

   TH1F *h = new TH1F("h","",100, 0.1, 1.);

   h->FillRandom("gaus", 21000);
   h->SetFillColor(kGray);
   h->SetLineColor(kGray);
   h->SetFillStyle(1001);


   TH1F *h2 = new TH1F("h2","",100, 0.1, 1.);

   h2->FillRandom("gaus", 16500);
   Int_t ci = 12345;
   TColor *color = new TColor(ci, 1., 1., 1.);
   h2->SetFillColor(ci);
   h2->SetLineColor(ci);
   h2->SetFillStyle(1001);

   TCanvas *c1 = new TCanvas("c1","",205,47,600,400);

   h->Draw("hist");
   h2->Draw("hist same");
   c1->RedrawAxis();
}

1 Like

Dear couet,

Thank you so much, it was the RedrawAxis function then that is needed and handle my problem. :blush:

Have a good day
Zane

1 Like

RedrawAxis is only there to repaint the axis tick marks erased by the painting of the white histogram.

This topic was automatically closed 14 days after the last reply. New replies are no longer allowed.