Drawing range for a TF2 function

Hi,

I would like to draw a TF2 function f(x,y). The problem is that the function values spread over a huge range. My goal is to restrict the drawing range in z to a certain interval, completely analog to

TCanvas c1(“test”,“test”,800,600);
TH1F *hr = c1.DrawFrame(1,1,10,10);
TF1 * func = some function;
func->Draw(“same”)

for a TF1 function.

How can I do this?

Thank you very much!

 TF2 *f2=new TF2("f2","sin(x)/x*cos(y)*y",-3,3,-3,3);
 f2->Draw("surf1")
 f2->SetMaximum(1)
 f2->SetMinimum(-1)

That was really easy - I apologize, thank you :slight_smile:

I have a little follow up question. This code

  TCanvas *c  = new TCanvas("c","Contours",0,0,800,700);
  c->SetLogx();
  //c->SetLogz();
  c->SetRightMargin(0.2);

  const Int_t NRGBs = 5;
  const Int_t NCont = 255;
  
  Double_t stops[NRGBs] = { 0.00, 0.34, 0.61, 0.84, 1.00 };
  Double_t red[NRGBs]   = { 0.00, 0.00, 0.87, 1.00, 0.51 };
  Double_t green[NRGBs] = { 0.00, 0.81, 1.00, 0.20, 0.00 };
  Double_t blue[NRGBs]  = { 0.51, 1.00, 0.12, 0.00, 0.00 };
  TColor::CreateGradientColorTable(NRGBs, stops, red, green, blue, NCont);
  gStyle->SetNumberContours(NCont);

  TF2 * master = get_masterfunction(-1.616);
  master->SetRange(1e1,0.1,1e3,1);
  master->SetNpx(10);
  master->SetNpy(10);
  master->SetMaximum(1e-7);
  master->SetMinimum(1e-10);

  master->Draw("colz");
  

produces this picture


However, setting the z axis to log scale, lead to this result


What am I doing wrong?

Can you provide something I can run ?
I get:

root [0] .x kingj.C
Error: Function get_masterfunction(-1.616) is not defined in current scope  kingj.C:17:

sorry, I don’t know how, this function interpolates a table, so there is a lot of stuff that I would need to provide you with. I will try to work around this display problem somehow.

Can you make a standalone example reproducing your problem ?

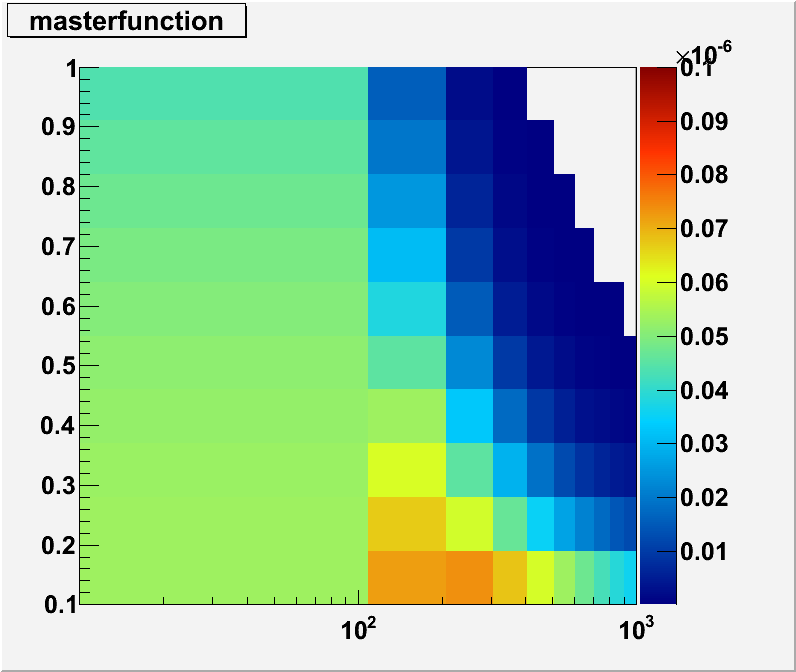
I worked around it by creating a histogramm, filling it by evaluating the function and drawing it. It don’t understand what the problem was, so it’s hard to reproduce it.
I had set the Canvas to log-log but worked in normal scale, so I had really tiny values. Now it do everything really in log-log, I assume it is related to that.
Sorry for this useless post.