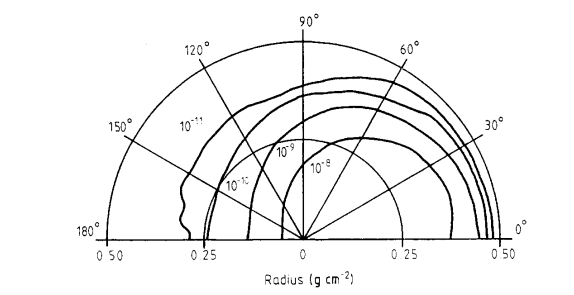
I have a 2D histogram that represents radius and angle.
I drew it by using the POL option but it did not work. I think I may define angle interval and draw counter lines by using the cont3 option. if it is correct I don’t know how can I define angle intervals and draw counter as a function of radius and angle.
how can I do this?
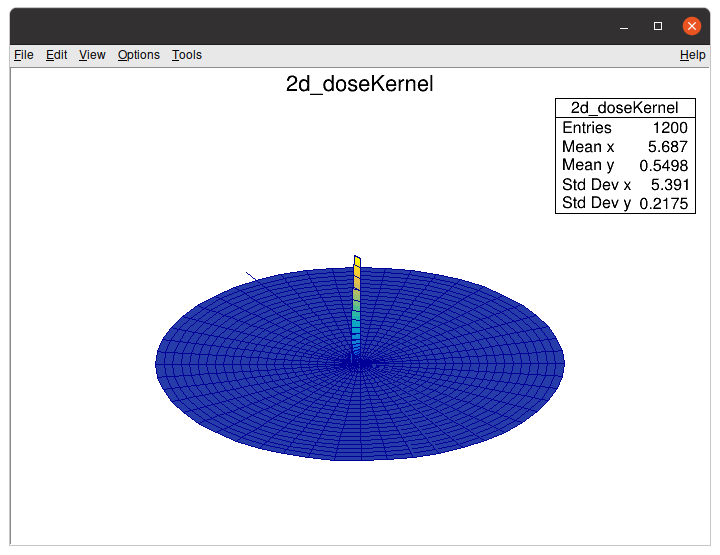
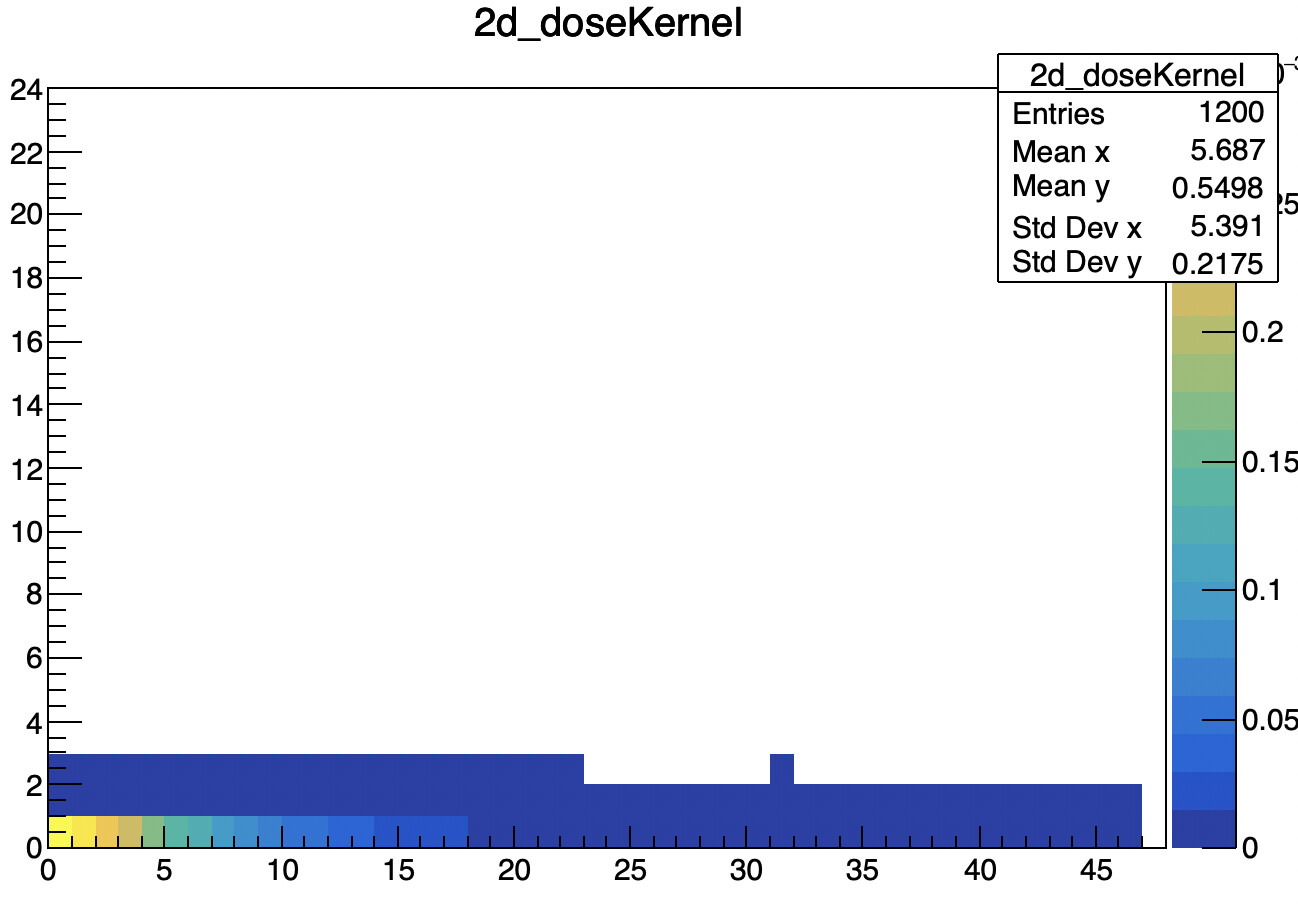
I attach my .root file, there is a 2d histogram in which 0-48 represents 48 angle intervals (3.75 degrees) and 0-24 represents radiuses.
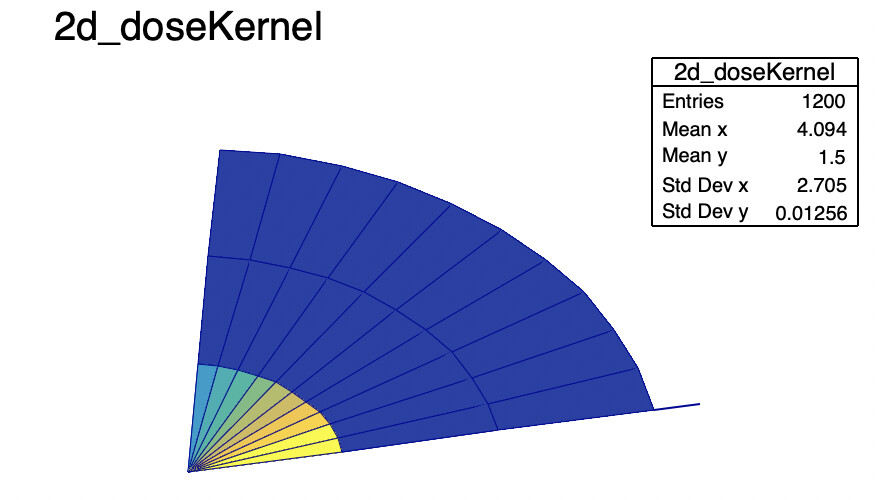
There is no simple option producing such plot (half circle) with contour plots from a TH2…
The Pol option is one way to represent polar plots. Also there is TGraphPolar. But none of them will produce such plot.
the picture that I sent, shows a half-circle plot because of its data, dawing half-circle is not critical, It can be a circle with data that are in a half-circle.
what is important is drawing a counter-polar plot.
thank you it is almost what i want, for achieving an accurate plot i must multiple each 0-48 degrees intervals by 3.75 for creating angle intervals and create another 2D histogram with new angle intervals and radius.
how can i represent radiuses and angles?, like the second picture that i sent.