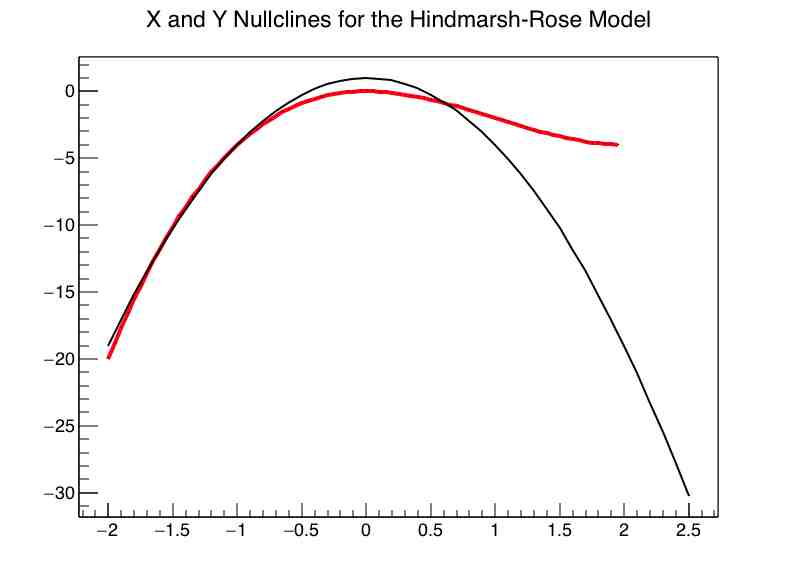
I drew x and y plots for the equations below, the graph is in the attachment.
Well, how might i draw null-clines which is (tiny) arrows between two plots as in differential equations?
y(x)=x^3-3x^2 --> x null-cline
y(x)=1-5x^2 --> y null-cline
Surely drawing arrows could be done in some TExec or in a simple macro. What is exactly the arrows postions ?
Can you post the macro you wrote which produces this plot ?