Hi, I am trying to draw multiple histograms in one canvas. All of them are normalized.
The code is here…
Double_t scale4 = 1/(hist1_4 ->Integral());
hist1_4->Scale(scale4);
Double_t scale3 = 1/(hist1_3 ->Integral());
hist1_3->Scale(scale3);
Double_t scale2 = 1/(hist1_2 ->Integral());
hist1_2 ->Scale(scale2);
Double_t scale = 1/(hist1 ->Integral());
hist1 ->Scale(scale);
hist1_3 ->GetXaxis()->SetTitle(“GeV”);
hist1_3->Draw(“same”);
hist1->Draw(“same”);
hist1_2->Draw(“same”);
hist1_4->Draw(“same”);
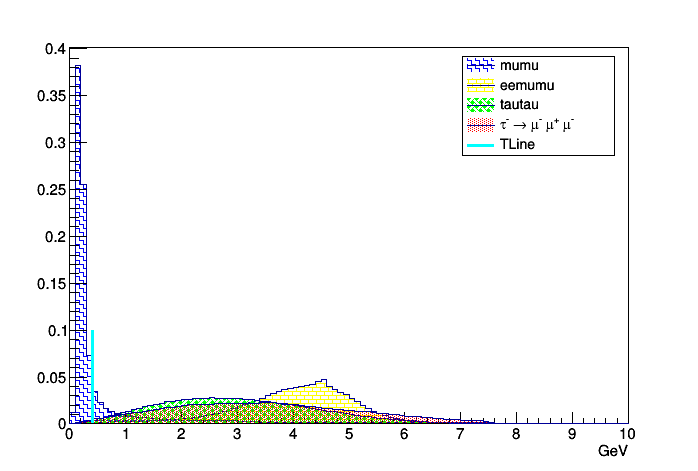
But after drawing one of the histogram has large peak so the others are diminished. Is it possible to increase heights of the all other histograms? So that all the histograms will be clearly visible in the canvas.