Hello All!
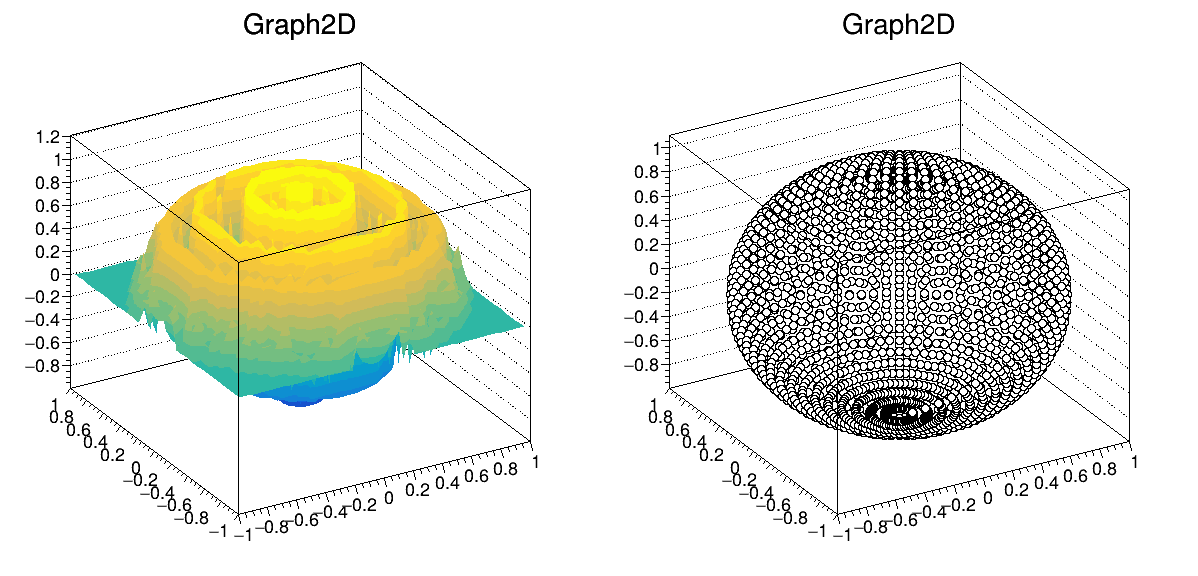
I am currently trying to make 3D plots of angular correlations for gamma-ray emissions and have stumbled upon a potential issue: because the function I am plotting is multi-valued in z, the triangularization that occurs to build the mesh during a Draw("SURF2") call fails. Plotting the function using a cloud of points does give the correct shape, but is obviously not visually appealing. Below is a reproducer of this behavior which plots a sphere using my current method. The P0 plot displays the correct shape, verifying that my plotting method makes sense, but the SURF2 plot fails. Is there any way to overcome this? I’ve looked around the docs for a bit but have not been able to find what I need. Thanks in advance for the help!
TGraph2D *g = new TGraph2D();

int nTheta = 180 / 5;
int nPhi = 360 / 5;

int p = 0;
for (int i = 0; i < nTheta; ++i)
{
double theta = i * TMath::Pi() / nTheta;

for (int j = 0; j < nPhi; ++j)
{
    double phi = j * 2.0 * TMath::Pi() / nPhi;

    double r = 1;

    double x = r * sin(theta) * cos(phi);
    double y = r * sin(theta) * sin(phi);
    double z = r * cos(theta);

    g->SetPoint(p++, x, y, z);
}

}

TCanvas *c = new TCanvas(“c”, “c”, 1200, 600);
c->Divide(2, 1);

c->cd(1);
g->Draw(“SURF2”);

c->cd(2);
g->Draw(“P0”);
ROOT Version: 6.40.00
Platform: Arch Linux
Compiler: gcc (GCC) 16.1.1 20260430