Drawing histograms with "COLZ" - How to move the z axis color legend

I previously found a way to move the TPaletteAxis drawn by TH2->Draw("colz"), however I don’t think it is a very good method / probably not the correct method, because using this code elsewhere in my macro caused a crash.

Here’s what I tried

    canvas->Update();
    TPaletteAxis *palette = (TPaletteAxis*)histo->GetListOfFunctions()->FindObject("palette");
    if(palette != nullptr)
    {
        palette->SetX1NDC(0.88 + 0.03);
        palette->SetX2NDC(0.92 + 0.03);
        palette->SetY1NDC(0.15);
        palette->SetY2NDC(0.9);
        palette->Draw();
    }
    gPad->Modified();
    gPad->Update();
    canvas->Modified();

I have been using this to move the location of the TPaletteAxis, because sometimes the numbers drawn are so large they run off the end of the TCanvas / TPad.

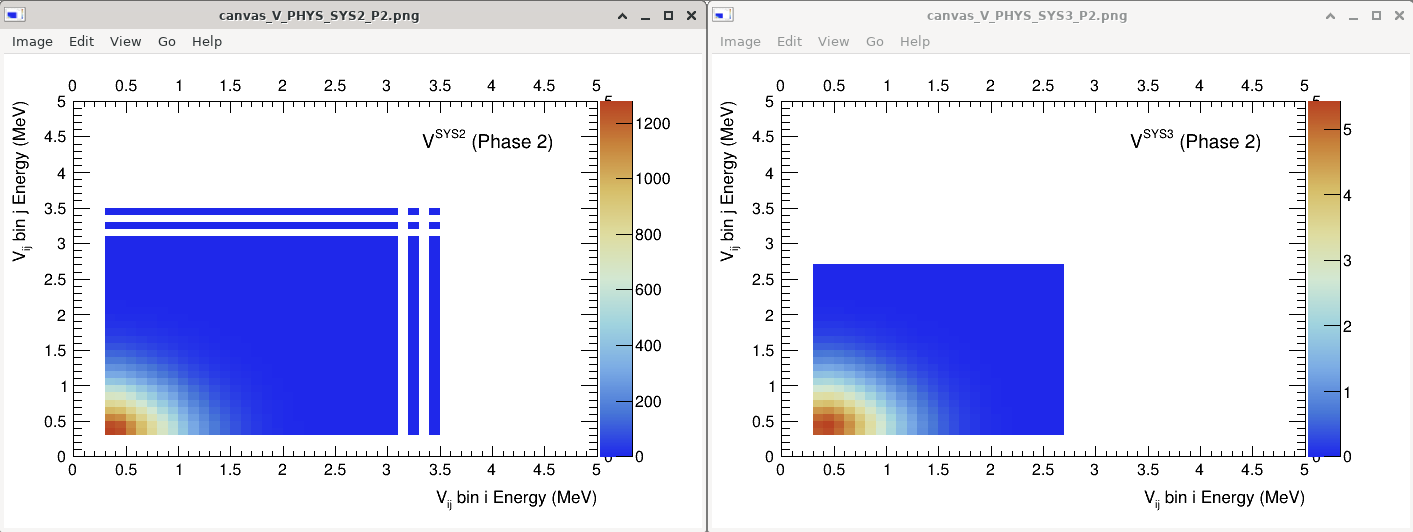
Additionally, if ticks are enabled on the right hand side of a plot, then the TPaletteAxis covers them.

See the example screenshots below…

My method is kind of clunky and I guess that there is a better/simpler/more elegant way to do this?

Hi,

I usually do the following, and this is pretty universal given you keep my size of the TCanvas:

TCanvas* canvas = new TCanvas("canvas", "Canvas title", 0, 0, 800, 600);
canvas->SetRightMargin(0.18); //to be able to see the z axis title, see https://root-forum.cern.ch/t/z-axis-title-th2f-colz/26426/3
histo->GetZaxis()->SetTitleOffset(1.3);
// draw your TH2 here
void movepal()
{
   TCanvas *myCanvas = new TCanvas("myCanvas", "myCanvas",5,44,550,550);
   gStyle->SetOptFit(1);
   gStyle->SetOptStat(0);
   myCanvas->Range(-0.8247861,-0.8247861,0.8247861,0.8247861);
   myCanvas->SetFillColor(10);
   myCanvas->SetBorderMode(0);
   myCanvas->SetBorderSize(0);
   myCanvas->SetTickx();
   myCanvas->SetTicky();
   myCanvas->SetLeftMargin(0.15);
   myCanvas->SetRightMargin(0.15);
   myCanvas->SetTopMargin(0.15);
   myCanvas->SetBottomMargin(0.15);
   myCanvas->SetFrameFillColor(0);
   myCanvas->SetFrameBorderMode(0);

   TH1 *h_myHisto = new TH2D("h_myHisto","",61,-0.0000107,0.0000107,61,-0.00085,0.00085);

   int binx(1), biny(1);
   for(int i = -30; i <=30; i++){
     biny=1;
     for(int j = -30; j <=30; j++){
       double x = double(i)/10.;
       double y = double(j)/10.;
       h_myHisto->SetBinContent(binx,biny,(x*x + y*y ));
       biny++;
     }
     binx++;
   }
   //Set up the colours I wish to use:
   const Int_t ncol = 9;
   Int_t colors[ncol];
   TColor *col;
   Double_t dg=1.0/(1.0*(Double_t)ncol);
   Double_t grey=0;
   for (Int_t i=0; i<ncol; i++) {
     colors[i]= i+101;
     if (gROOT->GetColor(colors[i])) {
       gROOT->GetColor(colors[i])->SetRGB(grey, grey, grey);
     } else {
       TColor *c = new TColor(colors[i], grey, grey, grey);
     }
     grey = grey+dg;
   }

   h_myHisto->SetContour(ncol);
   gStyle->SetPalette(ncol,colors);
   gStyle->SetOptStat(0);
   h_myHisto->SetMaximum(9);

   h_myHisto->GetZaxis()->SetTitle("Z Axis");

   h_myHisto->GetXaxis()->SetTitle("X axis #sigma_{X}");
   h_myHisto->GetXaxis()->SetNdivisions(-6);
   h_myHisto->GetXaxis()->SetLabelOffset(0.015);
   h_myHisto->GetXaxis()->SetLabelSize(0.035);
   h_myHisto->GetXaxis()->SetTitleSize(0.035);
   h_myHisto->GetXaxis()->SetTitleOffset(1.2);
   h_myHisto->GetYaxis()->SetTitle("Y axis #sigma_{Y}");
   h_myHisto->GetYaxis()->SetNdivisions(-6);
   h_myHisto->GetYaxis()->SetLabelOffset(0.015);
   h_myHisto->GetYaxis()->SetLabelSize(0.035);
   h_myHisto->GetYaxis()->SetTitleSize(0.035);
   h_myHisto->GetYaxis()->SetTitleOffset(2.4);
   h_myHisto->Draw("cont4z");

   myCanvas->Update();
   // Move the palette
   TPaletteAxis *palette = (TPaletteAxis*)h_myHisto->GetListOfFunctions()->FindObject("palette");
   palette->SetX1NDC(0.86);
   palette->SetX2NDC(0.90);
   palette->SetY1NDC(0.2);
   palette->SetY2NDC(0.8);
   myCanvas->Modified();
   myCanvas->Update();
   myCanvas->Print("movepal.pdf");
}

This topic was automatically closed 14 days after the last reply. New replies are no longer allowed.