Hello experts,
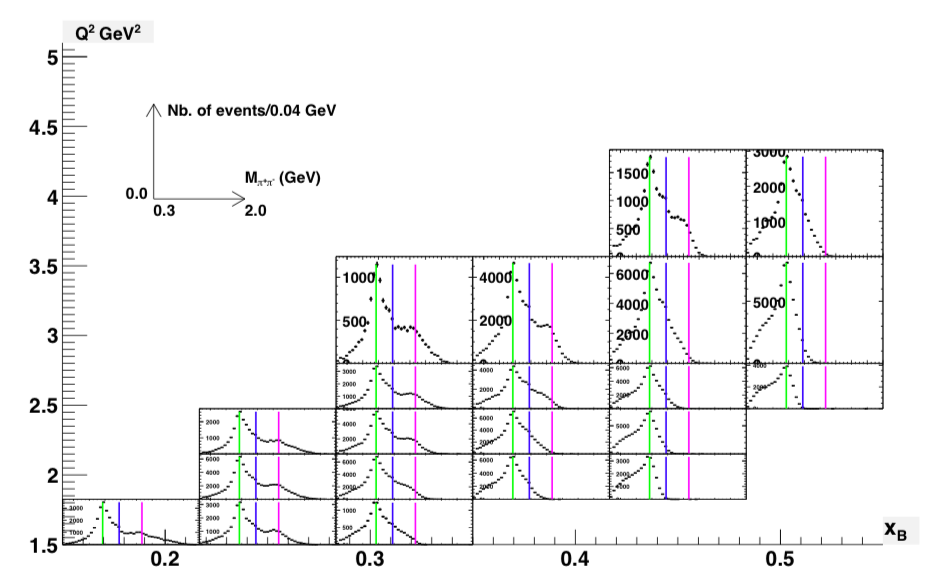
I wanna draw histograms inside the 2D binning.I attached a similar histogram that I need to draw.
And I want to know how to draw this type of plot using .root file.
Any tricks would be greatly appreciated.
This plot looks like done with ROOT already. You do not have the macro ?
You can also use TPad::DrawFrame to draw the two axis. Then you have to create all the sub-pads at the desired positions.