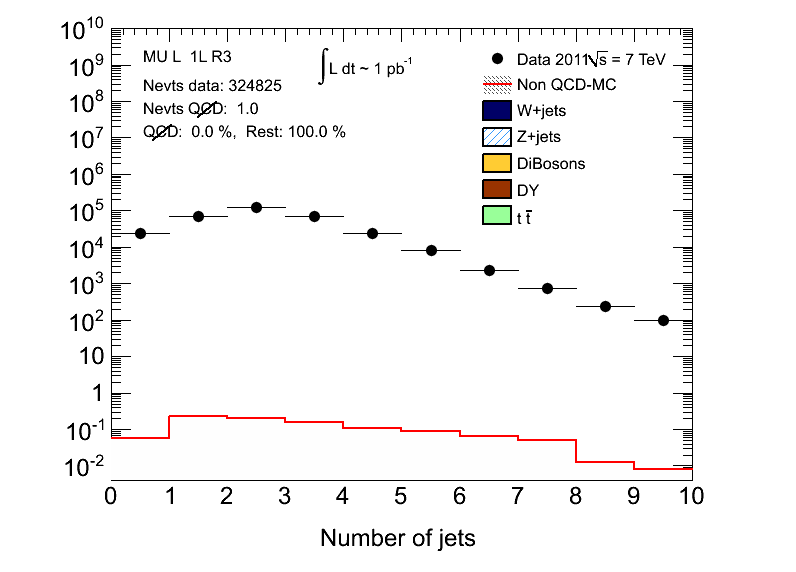
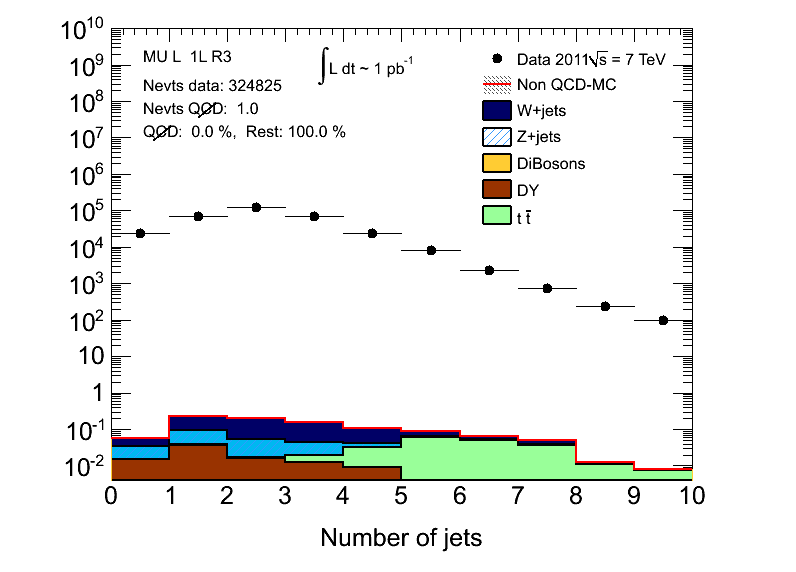
I am running a macro which draws several histograms, both histograms, filled, stacked, and with markers into the same plot. When running normally the histograms look like they should. When running in batch not all histograms are drawn correctly. It seems like it is the stacked histogram that does not make it. See attached files.
I am afraid that is not so easy. I have one macro which manages to plot correctly in batch mode, and another that does not. And they don’t really do very different things. In case you spot a problem with the actual macros I use, I attach them, however, they are not so simple and straightforward, and you cannot run them, since they rely on other files. If it is too difficult to spot the problem, then just don’t worry. I thought maybe this had been a known issue.
maikenp@helicity$ root
  *******************************************
  *                                         *
  *        W E L C O M E  to  R O O T       *
  *                                         *
  *   Version  5.26/00d    24 August 2010   *
  *                                         *
  *  You are welcome to visit our Web site  *
  *          http://root.cern.ch            *
  *                                         *
  *******************************************

ROOT 5.26/00d (tags/v5-26-00d@34963, Aug 24 2010, 13:30:22 on linux)

CINT/ROOT C/C++ Interpreter version 5.17.00, Dec 21, 2008
Type ? for help. Commands must be C++ statements.
Enclose multiple statements between { }.

Applying ATLAS style settings...
thank you for that tip. It seems this is the case. although it is curious that the white-filled histogram only covers the others when I run in batch mode. But it worked fine setting the fill to 0, before drawing it.
This is the sequence I used and worked fine when running in non-batch-mode:
But in batch mode I need to do this, and that is ok, it is not a big problem to add one line!
 hStack.Draw("hist same")
 h['mc'].SetFillStyle(0) //====> Sett fill to 0 otherwise in batch mode this histogram will cover the stack
 h['mc'].DrawCopy("hist same")
 h['mc'].SetFillStyle(3018)
 h['mc'].SetFillColor(12)
 h['mc'].Draw("e2same")