Please, how can I draw a histogram in all the pads of a divided canvas. I am attaching here a small example to illustrate the issue.
import ROOT
h = ROOT.TH1F('h','h',100,0.,10.)
h.FillRandom("gaus",10000)
can = ROOT.TCanvas("can","multipads",900,700)
ROOT.gPad.SetTickx(2)
can.Divide(3,2,0,0)
for j in range(6):
    can.cd(j+0)
    h.Draw()
can.SaveAs("Plots.png")
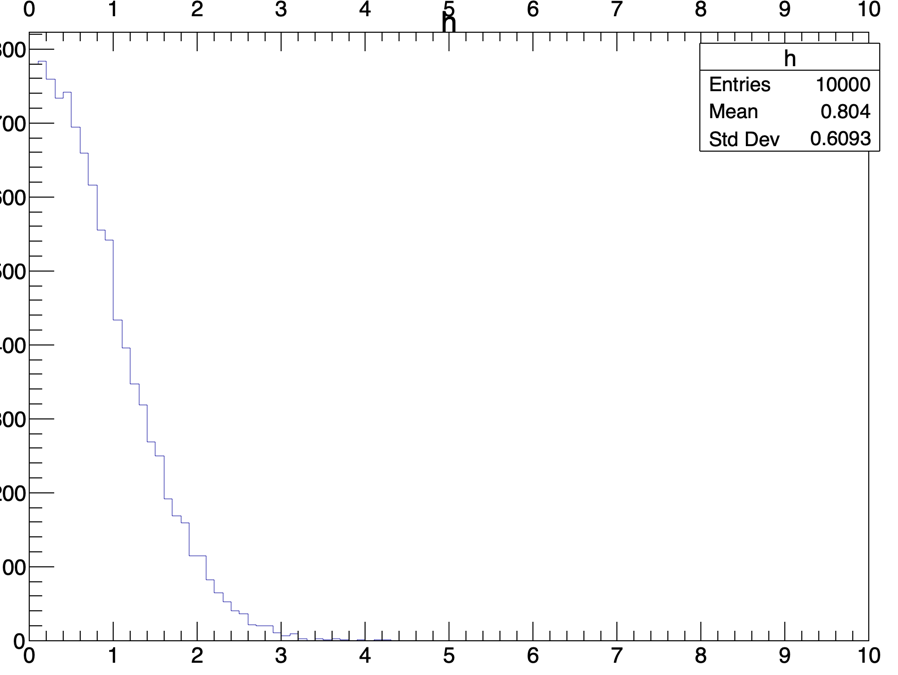
This only saves the final Pad as it is shown bellow
import ROOT
h = ROOT.TH1F('h','h',100,0.,10.)
h.FillRandom("gaus",10000)
can = ROOT.TCanvas("can","multipads",900,700)
ROOT.gPad.SetTickx(2)
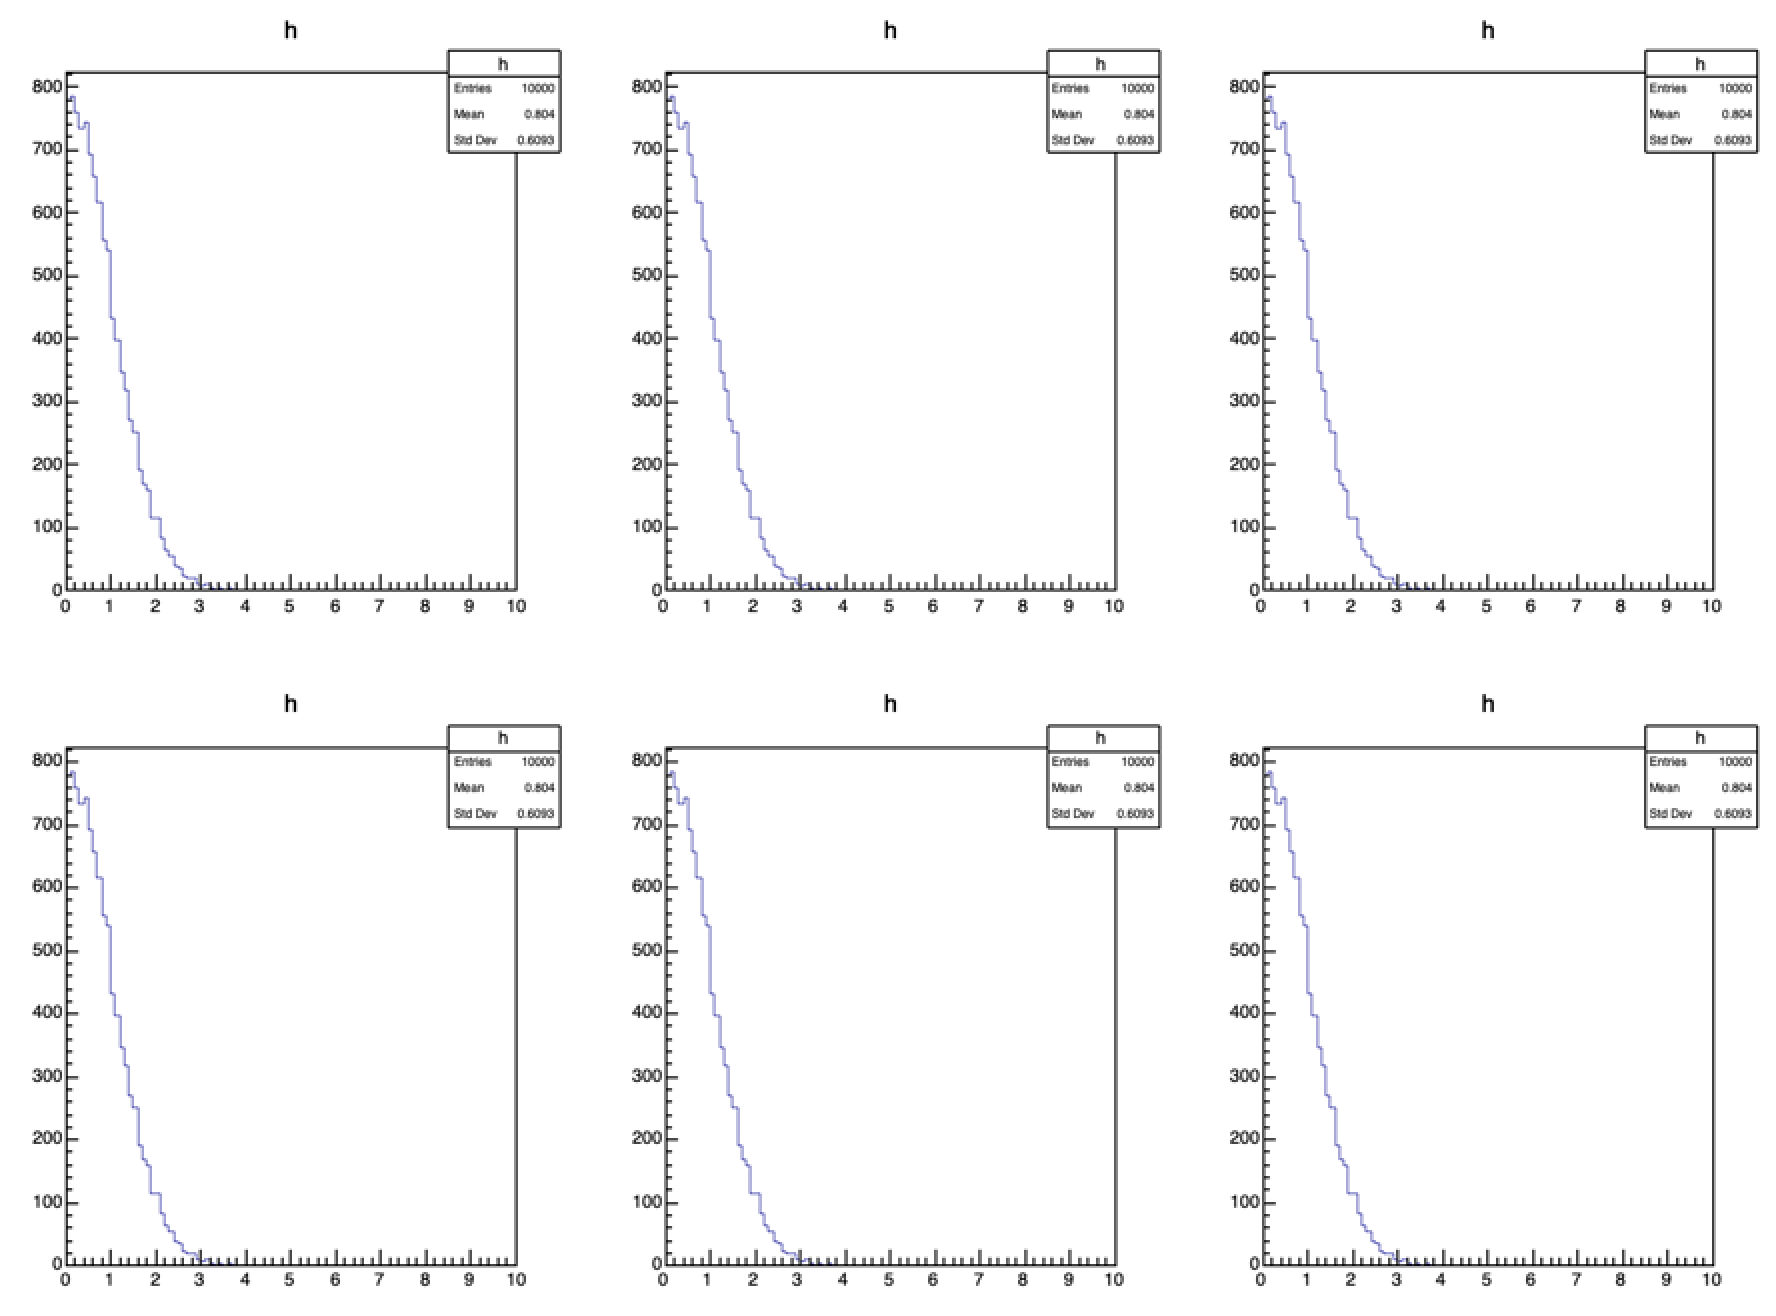
can.Divide(3,2)
for j in range(6):
can.cd(j+1)
h.Draw()
can.SaveAs("Plots.png")
import ROOT
h = ROOT.TH1F('h','h',100,0.,10.)
h.FillRandom("gaus",10000)
can = ROOT.TCanvas("can","multipads",900,700)
ROOT.gPad.SetTickx(2)
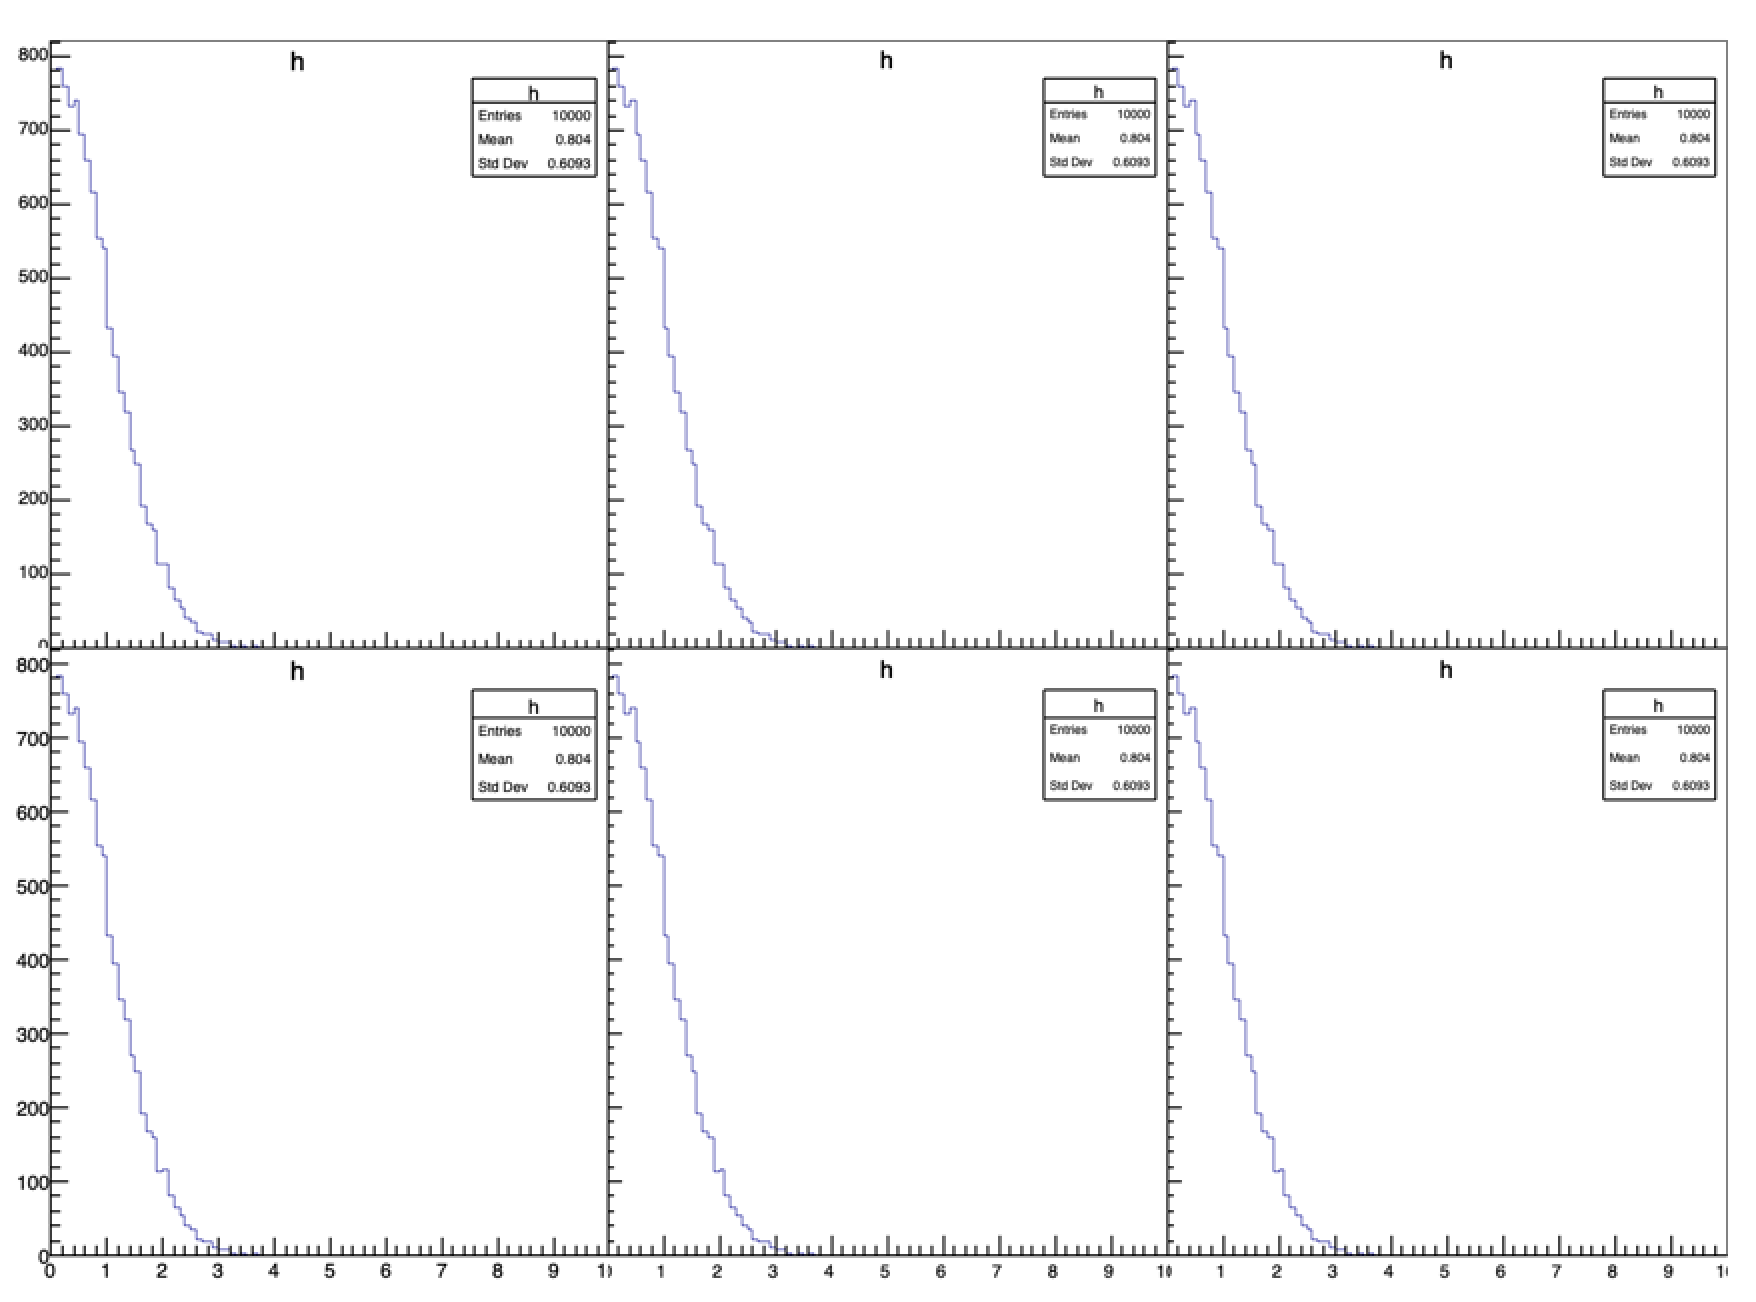
can.Divide(3,2,0,0)
for j in range(6):
can.cd(j+1)
h.Draw()
can.SaveAs("Plots.png")