Drawing Graphs with an offset in Y axis

Hello Rooters,

I am stuck at a step which I am pretty sure must have a straightforward fix. I have tried a few things and I am not sure what to do.
I have multiple graphs. I want to draw all these graphs in a single plot with an offset on Y-axis, such that every plot has a shift in Y-axis. This is what I did -

TGraph *gr2 = new TGraph ();

TCanvas *cgr2=new TCanvas(“cgr2”,“cExcitation Energy Spectrum 126”);

for(Int_t i=0; i< 21; i++){

    double energy = grdisk126->GetX() [i];

    double Counts = grdisk126->GetY() [i];

    Int_t shift = Counts + 1000; //CHECK DATA

    grdisk126->SetPoint(i, energy, shift);

    }

cgr2->cd();

gr2->Draw();

TMultiGraph *mg = new TMultiGraph();

TCanvas *cmg=new TCanvas(“cmg”," Excitation Energy Spectrum all data stacked");

mg->Add(grdisk118);

mg->Add(grdisk126);

This does not work and gives me an error- error in tgraphpainter::paintgraph: illegal number of points (0).

Can anyone suggest anything as to how to approach this? I want something that looks like the attached pdf.
Stacked plots-Logscale_1000bins.pdf (219.8 KB)

Please help! Thank you for your time!

ROOT Version: 6.18/04
Platform: C++
Compiler: Visual Studio Code

Your “gr2” seems to be empty (you did not add any points).

Can you post a running example showing the problem? what you post can not be run,

Hi @couet and @Wile_E_Coyote, Thank you for getting back. Here is a code that will run. I am also attaching the .root files because I am plotting .root files.

Also, I tried to plot the same plot in graph and as histogram. What I don’t understand is when I plot the histogram, everything lines up exactly (still having trouble with offset though), but when I plot as graph, there is slight shift in each data. Is that something that has to do with how THStack and multigraph works or is it some error in my code?
Can anyone please comment? Thank you for your time! Please help!

Disk118_graph.root (11.6 KB)
Disk126_graph.root (11.5 KB)
Disk179_graph.root (11.5 KB)

Overlay.cc (5.2 KB)
OverlayGraph.cc (6.6 KB)
Disk118.root (5.3 KB)
Disk126.root (5.3 KB)
Disk179.root (5.3 KB)
Disk186.root (5.2 KB)
Disk192.root (5.1 KB)
Disk211.root (5.2 KB)
Disk215.root (5.3 KB)
Disk186_graph.root (11.5 KB)
Disk192_graph.root (11.4 KB)
Disk211_graph.root (11.4 KB)
Disk215_graph.root (11.6 KB)

Can you clean up the macro so it runs with all the file in one folder ?

Processing Overlay.cc...
Error in <TFile::TFile>: file /root_v6.18.04/macros/HandOff/AlThin/Next steps/Disk118.ROOT does not exist

Do you mean something like this? (See attachments
Overlay.cc (4.8 KB)
OverlayGraphs.cc (6.2 KB)
)

Yes with this new version work. I did:

$ root Overlay.cc

I get:

does that show the problem ?

Hi @couet,
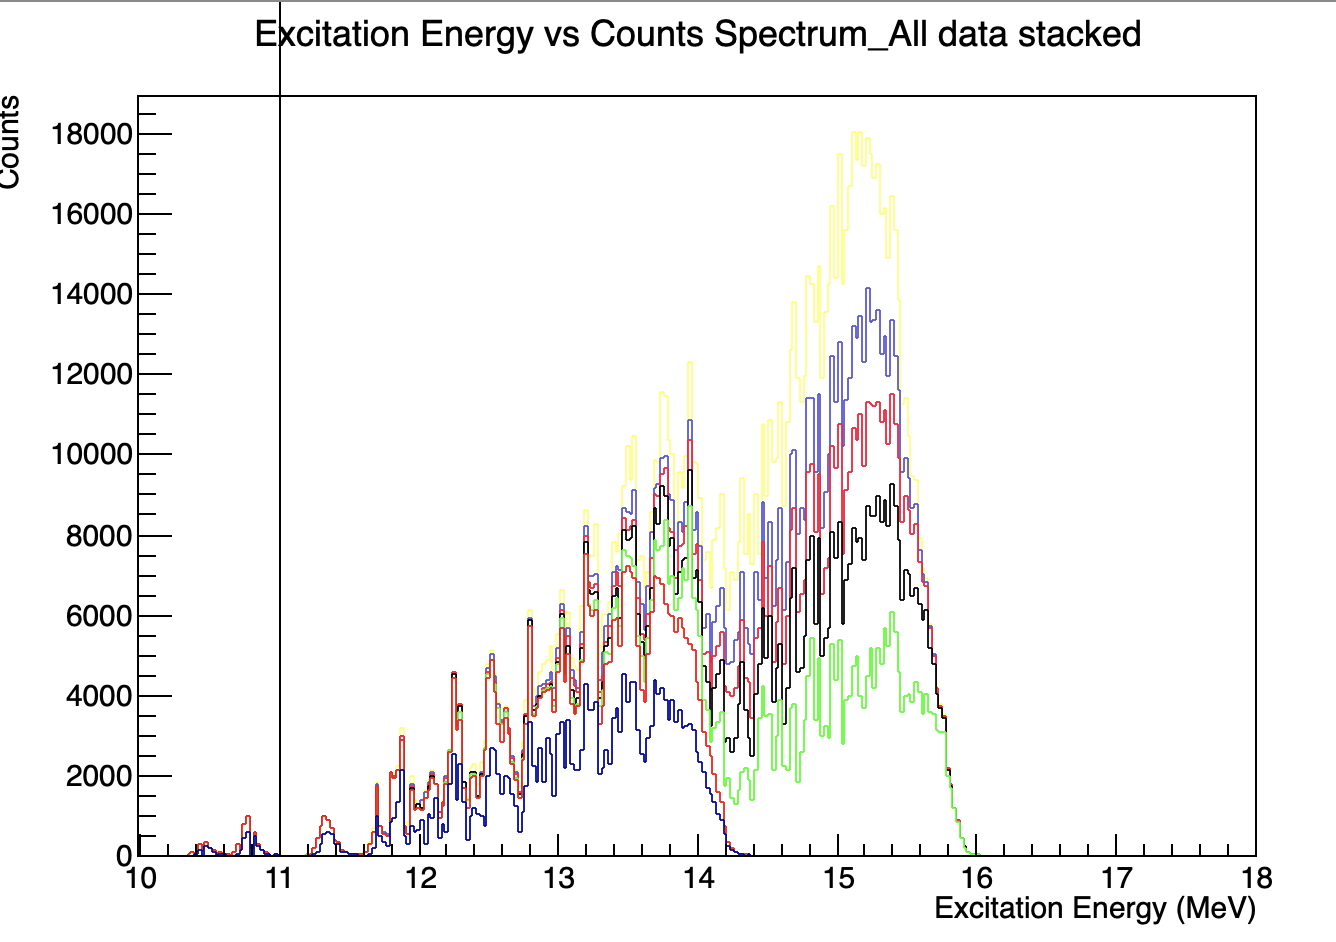
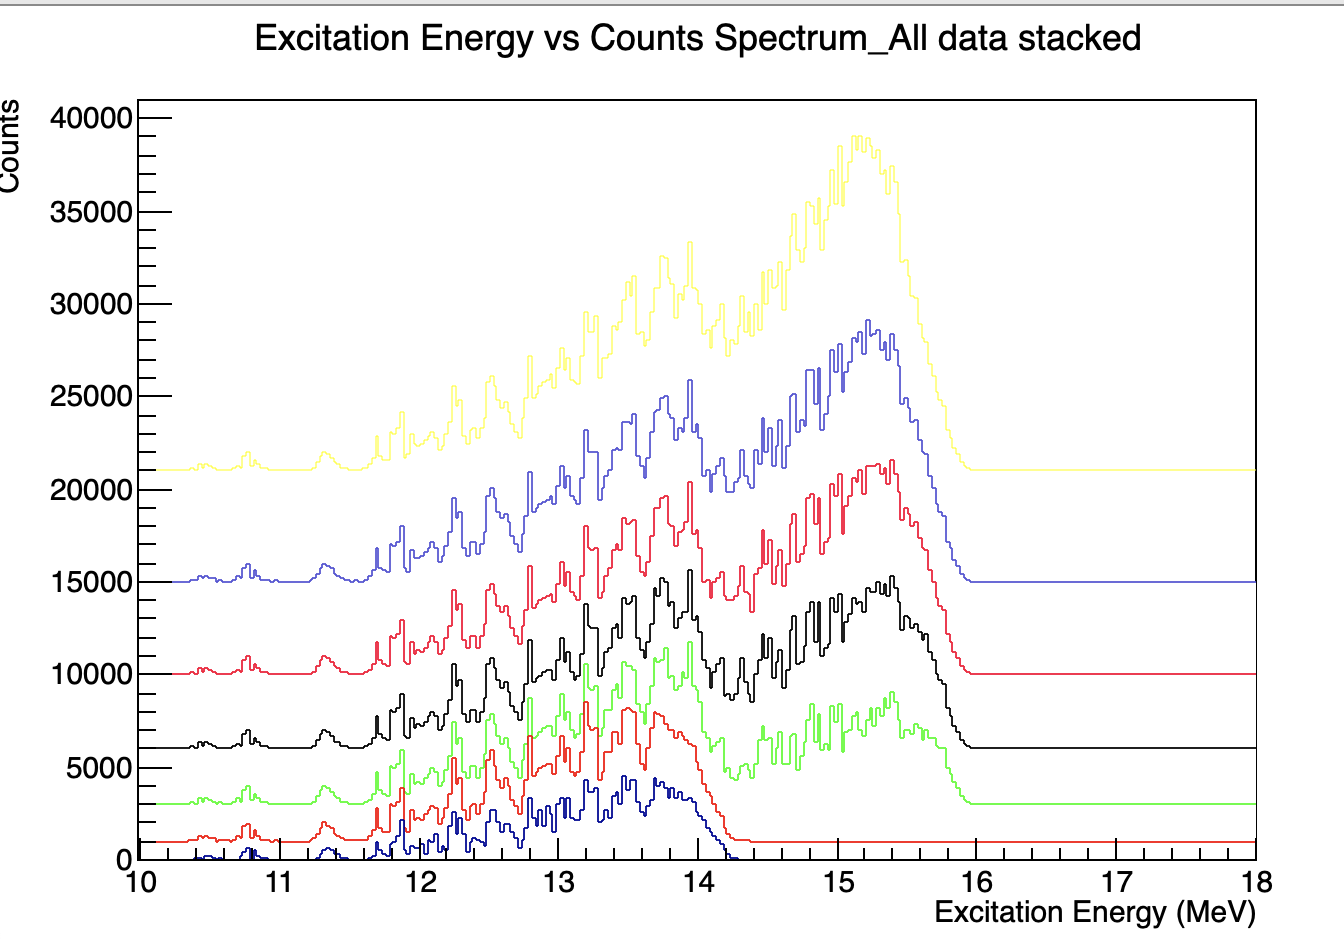
Thank you for getting back. So what I am saying is, this is stack histogram where different data sets are stacked. IN this plot, (the one you attached), all the peaks are perfectly aligned.
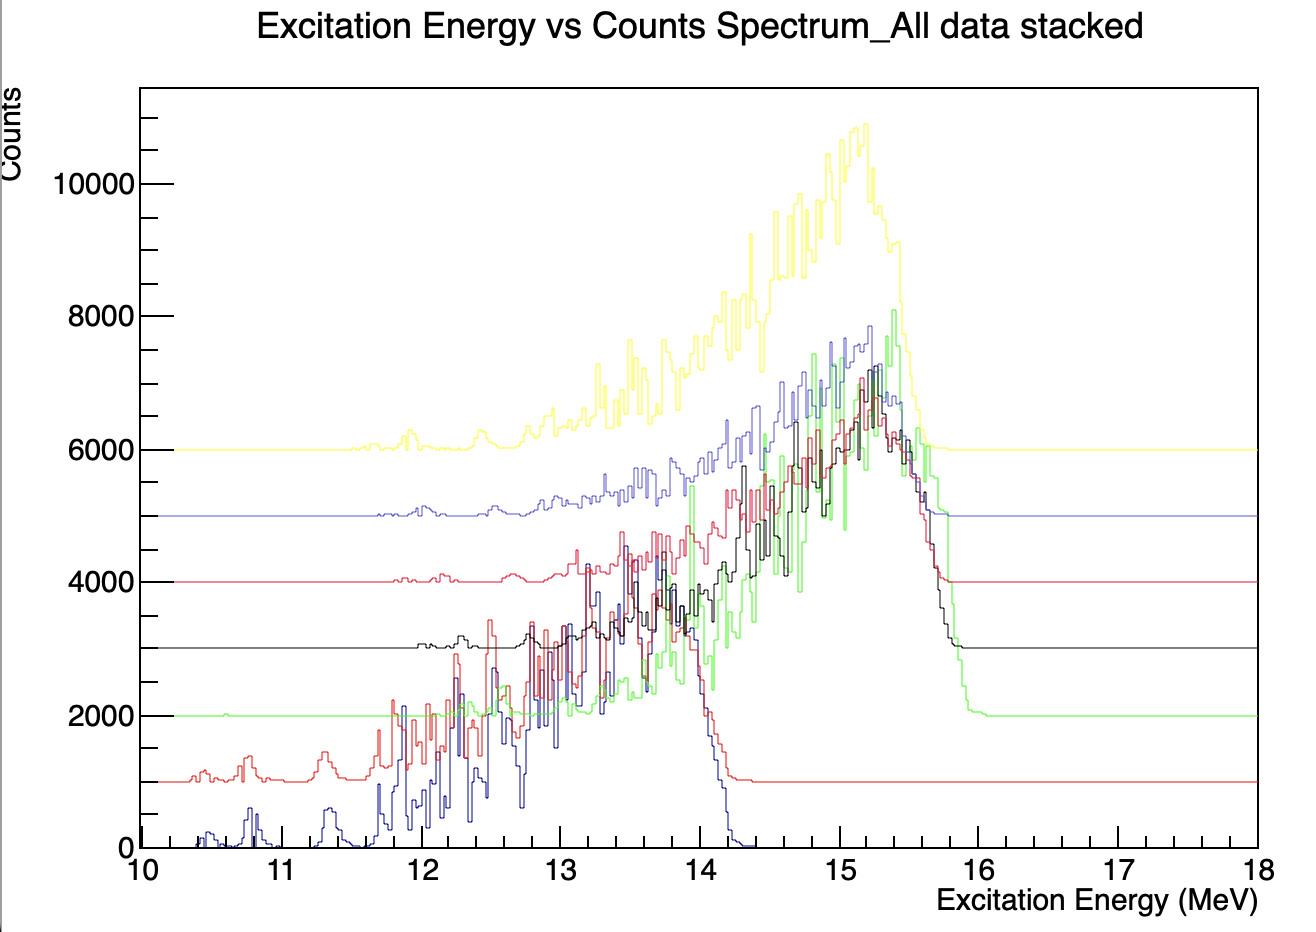
However, when I plot a multigraph using the same data, all the peaks are slightly shifted towards right from top to bottom(see attachment).
My question is there a reason why the histograms are aligned and graphs are shifted along x axis despite being the same data?

Do you think you can help? Any help is appreciated! Thank you for your time

P.S - Please ignore the offset in yaxis. I want to plot all the data with an offset in Y. For some reason, the offset is not getting plotted for the histogram but works for graphs.

I see . I might be a binning effect or something else. It should be checked…

In your “Overlay.cc”, you need: hdiskXYZ->SetBinContent(i, shift);
And you should probably draw it using: hs->Draw("hist nostack");

BTW. It can be that the x-axis values of your graphs, that you use in your “OverlayGraphs.cc”, are not “calibrated”.

1 Like
void Overlay()
{

   // This part opens the .ROOT file and plots them separately. The plots are saved as .ROOT files in the original DataAnalysis.Diskno.cc programs
   // This program will only work for previously saved .root files.
   TFile* inp = TFile::Open("Disk118.ROOT");
   TH1F* hdisk118 = (TH1F*)inp->Get("Disk118");

   TFile* inp1 = TFile::Open("Disk126.ROOT");
   TH1F* hdisk126 = (TH1F*)inp1->Get("Disk126");

   TFile* inp2 = TFile::Open("Disk179.ROOT");
   TH1F* hdisk179 = (TH1F*)inp2->Get("Disk179");

   TFile* inp3 = TFile::Open("Disk186.ROOT");
   TH1F* hdisk186 = (TH1F*)inp3->Get("Disk186");

   TFile* inp4 = TFile::Open("Disk192.ROOT");
   TH1F* hdisk192 = (TH1F*)inp4->Get("Disk192");

   TFile* inp5 = TFile::Open("Disk211.ROOT");
   TH1F* hdisk211 = (TH1F*)inp5->Get("Disk211");

   TFile* inp6 = TFile::Open("Disk215.ROOT");
   TH1F* hdisk215 = (TH1F*)inp6->Get("Disk215");

  // Now plotting all these graphs in a TGraph in a single plot with an offset

   THStack *hs = new THStack("hs","Excitation Energy vs Counts Spectrum_All data stacked");
   hs->Add(hdisk118);

   for(Int_t i=0; i< 801; i++){
   double ex = hdisk126->GetBinCenter(i);
   double Counts = hdisk126->GetBinContent(i);
   Int_t shift = Counts + 1000; //CHECK DATA
   hdisk126->SetBinContent(i, shift);
   }
   hdisk126->SetLineColor(kRed);
   hs->Add(hdisk126);

   for(Int_t i=0; i< 801; i++){
      double ex = hdisk179->GetBinCenter(i);
      double Counts = hdisk179->GetBinContent(i);
      Int_t shift = Counts + 2000; //CHECK DATA
      hdisk179->SetBinContent(i, shift);
   }
   hdisk179->SetLineColor(kGreen);
   hs->Add(hdisk179);

   for(Int_t i=0; i< 801; i++){
      double ex = hdisk186->GetBinCenter(i);
      double Counts = hdisk186->GetBinContent(i);
      Int_t shift = Counts + 3000; //CHECK DATA
      hdisk186->SetBinContent(i, shift);
   }
   hdisk186->SetLineColor(kBlack);
   hs->Add(hdisk186);

   for(Int_t i=0; i< 801; i++){
      double ex = hdisk192->GetBinCenter(i);
      double Counts = hdisk192->GetBinContent(i);
      Int_t shift = Counts + 4000; //CHECK DATA
      hdisk192->SetBinContent(i, shift);
   }
   hdisk192->SetLineColor(kPink);
   hs->Add(hdisk192);

   for(Int_t i=0; i< 801; i++){
      double ex = hdisk211->GetBinCenter(i);
      double Counts = hdisk211->GetBinContent(i);
      Int_t shift = Counts + 5000; //CHECK DATA
      hdisk211->SetBinContent(i, shift);
   }
   hdisk211->SetLineColor(9);  // This is purple
   hs->Add(hdisk211);

   for(Int_t i=0; i< 801; i++){
      double ex = hdisk215->GetBinCenter(i);
      double Counts = hdisk215->GetBinContent(i);
      Int_t shift = Counts + 6000; //CHECK DATA
      hdisk215->SetBinContent(i, shift);
   }
   hdisk215->SetLineColor(kYellow);
   hs->Add(hdisk215);

   TCanvas *cst = new TCanvas("cst","stacked hists");

   hs->Draw("hist");

   hs->GetXaxis()->SetTitle("Excitation Energy (MeV)");
   hs->GetYaxis()->SetTitle("Counts");
   hs->GetXaxis()->SetRangeUser(10,18);
   gPad->Modified();
   gPad->Update();
   hs->SaveAs("Excitation Energy vs Counts Spectrum_All data stacked.pdf");

}

1 Like

@couet Maybe: hs->Draw("hist nostack");

1 Like

We had the same idea at the same time.
hs->Draw("hist nostack");
gives:


so the data in both histograms and graphs are not calibrated.

1 Like

Thank you for getting back @couet and @Wile_E_Coyote. I just had one more question. What does it mean by the histogram and graph “not calibrated”?
Could you please suggest to me where to look for how to do a calibration? Thank you so much for your time and help!
I really appreciate it!

The positions of peaks in your different graphs / histograms do not “coincide”.
Well, we assume that their “x” positions should be the same in all graphs / histograms, but maybe not, as it depends on “physics”.
So, we think that you probably need to “scale” the x-axes values of them (i.e., “calibrate” the x-axes of your graphs / histograms from “raw” numbers to “energy”).
You need to discuss it with the one who gave you this data.

Thank you @Wile_E_Coyote. This was very helpful! Appreciate your time!