Hello ROOT users, hope you are doing great!
I am quiet new at ROOT and want to plot graphs of output of energy spectrum of transmitted,reflected and exited particles via Geant4(see screenshots)… But,I have no idea to draw them. Any kind of help will prove fruitful.
Thanks for your time and consideration.
May be that’s a question for the Geant 4 forum?
Nope. Graphs should be drawn in the root.
Do you have some data stored in a root file or in a text file ?
Hi @Afzaal786,
and welcome to the ROOT forum!
Would a TGraph fit the bill?
You can also check the “Graphics” and “Graphs” tutorials here.
Hope this helps,
Enrico
The screenshot in the first post seems to come from the “geant4.../examples/extended/electromagnetic/TestEm5” so you need to have a look into its source code (in particular search for the “vis.mac” and its “visManager”).
1 Like
Dear ROOT users, i am following this link to access to ROOT graphs
https://www-root.fnal.gov/root/GettingStarted/GettingStarted.htm
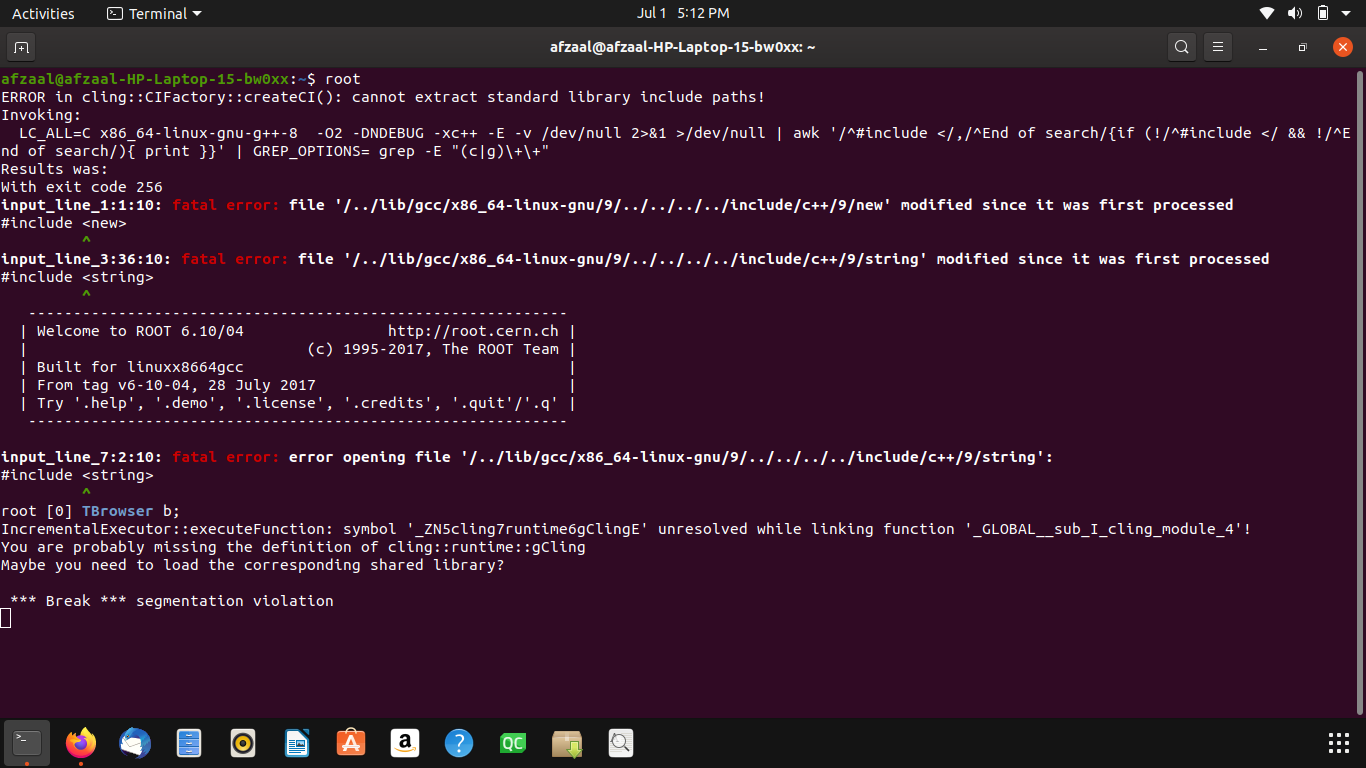
but when i typed command TBrowser b; in root[0], than instead of new screen following error occured(see screenshot)
Your ROOT executable seems a big “sick” you get errors just starting ROOT.
Is the variable $ROOTSYS defined ?
Note also that 6.10 is a bit old.
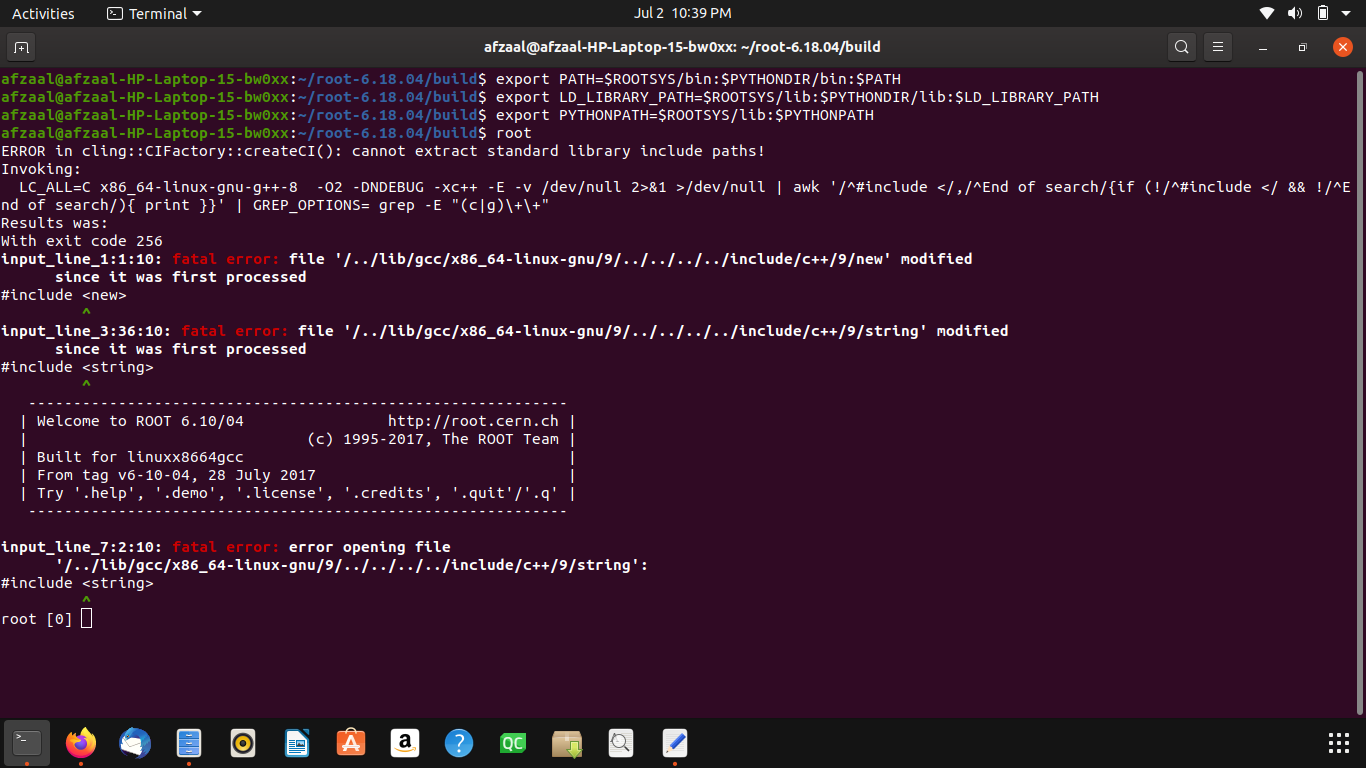
Hi, i have installed ROOT_v6.18.04 on ubuntu 19.10 successfully. But when i wrote root command to open root then it’s still showing root v6.10.04(see screenshot). I followed all the steps of installation and successfully implemented those(make -jN take ~ 1.30 hour). Kindly tell me what is the issue?
Screenshot from 2020-07-02 22-39-07|690x387
Have you run the script thisroot.sh ?
Yes, but still same error.
Dear couet, how can i delete root 6.10 version? It’s directory is invisible.
The linux command which root should tell you where it is.
This topic was automatically closed 14 days after the last reply. New replies are no longer allowed.