Dear experts,
I have figured out most of the parts. But I am a bit struggling with the drawing options.
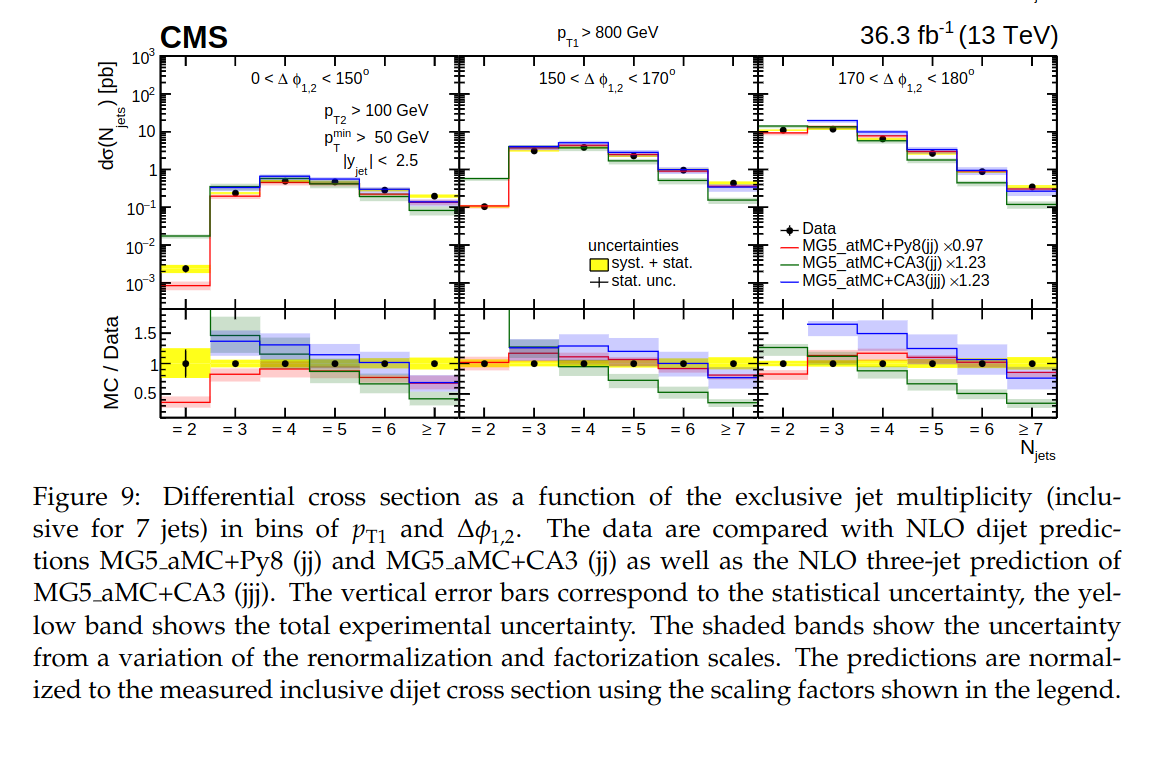
Please suggest how I can do the plotting style I have posted in the first message.
Basically, I want
- For Data → Marker+Filled Error bar in the upper pad
- For MC → Line+Hatched Error bar in the upper and lower pad
This is the macro I have. And please suggest if there are any other ways to do this. And I want to use TH1D not THStack.
#include <TCanvas.h>
#include <TH1D.h>
#include <TRandom.h>

void ErrorPlot() {

    TRandom3 randGen;

    TCanvas* canvas = new TCanvas("canvas", "Three Histograms", 800, 600);

    TH1D* hist1 = new TH1D("hist1", "Data", 10, -5, 5); //Data
    TH1D* hist2 = new TH1D("hist2", "Stat Errors", 10, 0, 10);    //Stat
    TH1D* hist3 = new TH1D("hist3", "Total Errors", 10, 0, 10);   //Tot
    TH1D* hist4 = new TH1D("hist4", "Central Values with Stat Errors", 10, -5, 5); //DataStat
    TH1D* hist5 = new TH1D("hist5", "Central Values with Total Errors", 10, -5, 5); //DataTot
    TH1D* hist6 = new TH1D("hist6", "MC", 10, -5, 5); //MC

    for (int i = 0; i < 10000; i++) {
        double value1 = randGen.Gaus(0.0, 1.0);
        hist1->Fill(value1);
    }

    /*
    for(int i=1; i<=hist1->GetNbinsX(); i++){
	    cout<<"his1 : "<<hist1->GetBinError(i)<<endl;
    }
    */

    for (int i = 1; i <= 10; ++i) {
	hist2->SetBinContent(i,0.5*i);
	hist3->SetBinContent(i,1.5*i);
	//cout<<"hist2 Bin Content: "<<hist2->GetBinContent(i)<<endl;
	//cout<<"hist3 Bin Content: "<<hist3->GetBinContent(i)<<endl;
    }

    for (int i = 1; i <= 10; ++i) {
        double centralValue1 = hist1->GetBinContent(i);
	double error2 = hist2->GetBinContent(i);
	double error3 = hist3->GetBinContent(i);

	hist4->SetBinContent(i, centralValue1); hist4->SetBinError(i, error2);
	hist5->SetBinContent(i, centralValue1); hist5->SetBinError(i, error3);
	//cout<<"hist4 Bin Error : "<<hist4->GetBinError(i)<<endl;
	//cout<<"hist5 Bin Error : "<<hist5->GetBinError(i)<<endl;
    }

    for (int i = 0; i < 20000; i++) {
        double value6 = randGen.Gaus(0.0, 1.0);
        hist6->Fill(value6);
    }

    TH1D *hist1_v1 = (TH1D*)hist1->Clone();
    TH1D *hist4_v1 = (TH1D*)hist4->Clone();
    TH1D *hist5_v1 = (TH1D*)hist5->Clone();
    TH1D *hist6_v1 = (TH1D*)hist6->Clone();

    hist1_v1->Scale(1/hist1_v1->Integral());
    hist4_v1->Scale(1/hist4_v1->Integral());
    hist5_v1->Scale(1/hist5_v1->Integral());
    hist6_v1->Scale(1/hist6_v1->Integral());

    TPad *pad1_v1 = new TPad("pad1_v1", "pad1_v1", 0, 0.3, 1.0, 1.0);
    	gStyle->SetOptStat(0);
        pad1_v1->SetBottomMargin(0.0);
        pad1_v1->Draw();
        pad1_v1->cd();

    hist1_v1->SetTitle("");
    hist1_v1->SetMarkerStyle(20);
    hist1_v1->SetMarkerSize(1);
    hist1_v1->SetLineColor(kBlue);
    hist1_v1->SetFillColor(kYellow);
    hist1_v1->Draw("e2");

    //hist6_v1->SetMarkerStyle(20);
    //hist6_v1->SetMarkerColor(kRed);
    //hist6_v1->SetMarkerSize(0);
    hist6_v1->SetLineColor(kRed);
    hist6_v1->SetFillColor(kRed);
    hist6_v1->SetFillStyle(3001);
    hist6_v1->Draw("same e2");   //drawing option line required with hatched error bar

    hist4_v1->SetLineColor(kGray);
    hist4_v1->SetFillColor(kGray);
    hist5_v1->SetLineColor(kYellow);
    hist5_v1->SetFillColor(kYellow);

    TLegend* legend1 = new TLegend(.7,0.7,0.88,0.88);
    	legend1->SetBorderSize(0);
        legend1->AddEntry(hist1_v1, "Data", "lp");
        legend1->AddEntry(hist6_v1, "MC", "lfp");
	legend1->AddEntry(hist4_v1, "Statistical Uncertainty","f");
	legend1->AddEntry(hist5_v1, "Total Uncertainty","f");
        legend1->Draw();

    canvas->cd();

    TPad *pad1_v2 = new TPad("pad1_v2", "pad1_v2", 0, 0.05,1.0, 0.3);
    	pad1_v2->SetTopMargin(0.0);
        pad1_v2->SetBottomMargin(0.2);
        pad1_v2->Draw();
        pad1_v2->cd();

    TH1D* hist6_v2 = (TH1D*)hist6->Clone();
    hist6_v2->Scale(1/hist6_v2->Integral());

    TH1* ratio = (TH1*)hist6_v2->Clone();
    TH1* Stat = (TH1*)hist6_v2->Clone();
    TH1* Tot = (TH1*)hist6_v2->Clone();

    ratio->Divide(hist1_v1);
    Stat->Divide(hist4_v1);
    Tot->Divide(hist5_v1);

    Tot->SetFillColor(kYellow);
    Tot->Draw("e2");

    Stat->SetFillColor(kGray);
    Stat->Draw("same e2");

    ratio->SetLineColor(kRed);
    //ratio->SetFillColor(kRed);
    //ratio->SetFillStyle(3001);
    ratio->Draw("same hist");

    Tot->SetTitle("");
    Tot->SetMinimum(0.0);
    Tot->SetMaximum(2.0);
    Tot->SetStats(0);

    Tot->GetXaxis()->SetTitleSize(0.13);
    Tot->GetXaxis()->SetTitleOffset(1.15);
    Tot->GetXaxis()->SetLabelSize(0.1);
    Tot->GetXaxis()->CenterTitle();

    Tot->GetYaxis()->SetTitle("MC/Data");
    Tot->GetYaxis()->CenterTitle();
    Tot->GetYaxis()->SetNdivisions(505);
    Tot->GetYaxis()->SetTitleSize(0.12);
    Tot->GetYaxis()->SetTitleOffset(0.35);
    Tot->GetYaxis()->SetLabelSize(0.09);

    TLine* line_v1 = new TLine(hist1_v1->GetXaxis()->GetXmin(), 1, hist1_v1->GetXaxis()->GetXmax(), 1);
    line_v1->SetLineStyle(2);
    line_v1->Draw();

    canvas->SaveAs("ErrorPlot.pdf");
}
Regards.
Soumyadip