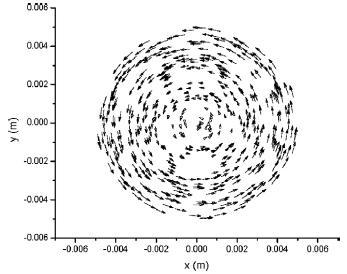
I want to use root to draw (x,y) data points with arrows indicating momentum vector similar to the attached figure. Is there an example of doing such a figure in root. I searched a little bit and found an old request but not that helpful.
I don’t think any ROOT classes are even appropriate for storing data points in the form (x,y,rho,theta) where (x,y) are spatial coordinates and (rho,theta) would be the magnitude & direction of a 2D vector. Nothing I could find would plot that.
Gnuplot does have an option “with vectors” that you could try: http://gnuplot.sourceforge.net/docs_4.2/node259.html but you’d have to reformat your data to be in the (x,y,deltax,deltay) format specified. That would involve finding a dimensionful scaling factor to change your momenta into space intervals so they show up properly on the plot.
Of course you can draw that using the basic graphics tools provided by ROOT (TArrow etc…). But you will have to implement the algorithm yourself. If you do something like that you can also add in the user’s contribution section of this forum.