I plotting fom vs cut value by using TGraph. Here I am reading fom values and cut values from text file and plotting by using TGraph. I want to draw one arrow at the cut value where the fom value is maximum(which I can know from the text file). Could somebody suggest me how to do it?
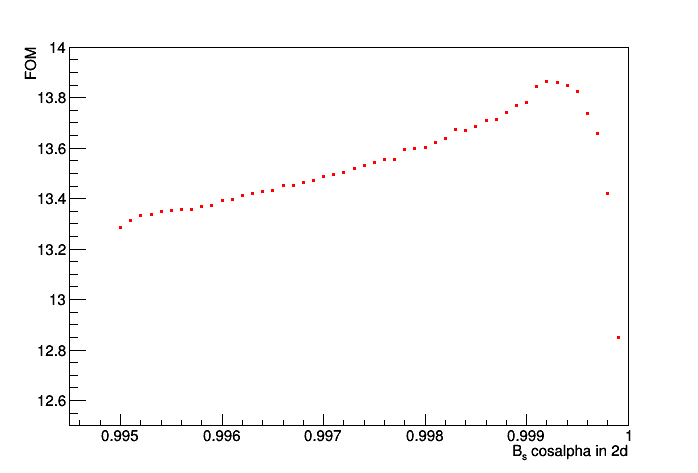
I have attached the plot.I want to draw an arrow at Bs cosalpha in 2d = 0.9992, to show the fom value for this Bs cosalpha in 2d value. Could you please tell me how to draw?
You can draw a TArrow using the axis coordinates of your plot. Simply compute the TArrow position, pass them to the TArrow constructor and draw the TArrow using the Draw() method. As in the example Danilo mentionned.