I have a TGraph2D that I want to draw using cont4z. However, I also want to draw a single specific contour over the top of the TGraph2D as a black line or something. I understand that cont4 imposes its own coordinate system on the pad, and so I have followed the advice given here…
…which has led to a complication. As you can see in the attached code, when I switch to the second, blank TPad, I have to draw a frame corresponding to that in the first TPad; otherwise, the single contour I want to emphasize is drawn over the whole range of the pad, and not the area of the pad that matches the cont4 pad. But when I use gPad->DrawFrame(), it somehow destroys the “blank” nature of the second TPad.
I had to do ’ configure’ with rootfit enabled.
with that your macro gives me:
Processing histInvSm.C...

RooFit v3.14 -- Developed by Wouter Verkerke and David Kirkby
                Copyright (C) 2000-2010 NIKHEF, University of California & Stanford University
                All rights reserved, please read http://roofit.sourceforge.net/license.txt

Error: Non-static-const variable in array dimension histInvSm.C:71:
 (cint allows this only in interactive command and special form macro which
  is special extension. It is not allowed in source code. Please ignore
  subsequent errors.)
*** Interpreter error recovered ***
Yes, that’s what I get, too (ROOT 5.28/00b, Ubuntu 10.04.2 LTS, i686, gcc 4.4.3).
Replace:
TCanvas* tempCanv = new TCanvas("","",2); // is an empty “name” allowed at all?
with:
TCanvas* tempCanv = new TCanvas(“tempCanv”,“tempCanv”,2);
and you’ll get another canvas displayed.
I’m using 5.28/00a, MacOSX64 and, yes, I’m running the macro with .x histInSm.C+ .
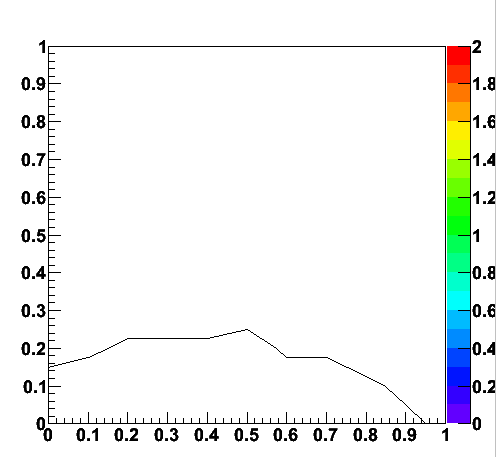
I use that first tempCanv to draw the contours and “list” them, so I can extract the one I want and hopefully overlay it on the cont4 later, on the other canvas.
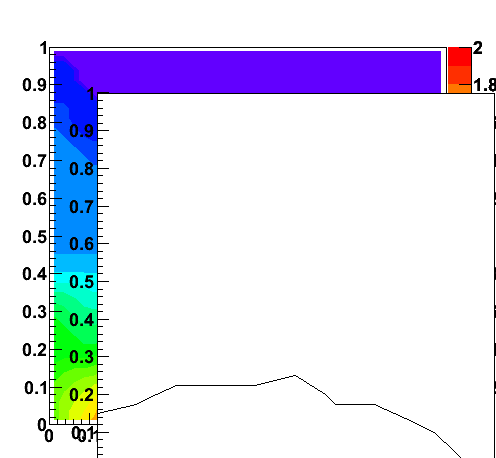
I get the attached, which is just the single contour line I want, but with a white background:
If you drag the white background off to the side, though, you can see the cont4 plot on the pad underneath:
Have you been able to solve this? I’ve run into the same problem with ROOT 5.28.00.
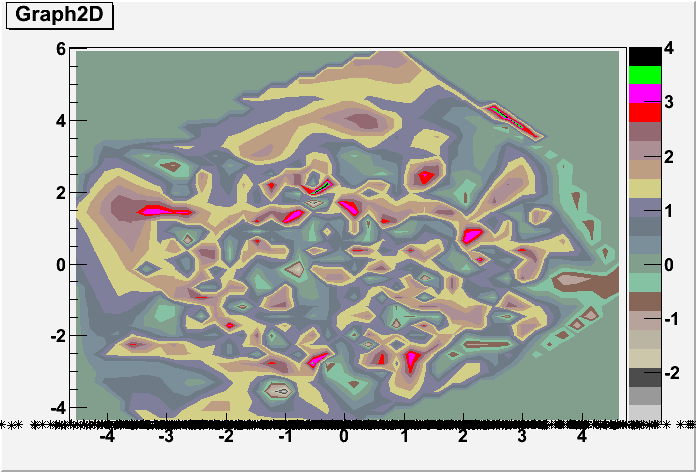
I’ve attached a minimally modified version of transpad.C where I draw a CONT4 Graph2D and try to overlay it with a TGraph. But the TGraph has a white background, like in your screenshots above, that covers the Graph2D below it. transpad.C (1.75 KB)
I do have one more question though. Is it possible to remove the axes from the TGraph? Right now, it draws them on top of the TGraph2D’s axis and it doesn’t look very nice as they overlap a bit. I tried removing the “A” option from the Draw function, which gets rid of the axes but collapses all of the points into one line, as shown in the attached image. I’ve also tried setting the ranges on the axis (when the A option was not used) as shown here: root.cern.ch/drupal/content/how-set-ranges-axis , but that didn’t help.
Before removing the axis I would make sure they overlap exactly.
If they do not overlap (at least the tick marks) it means that the two scales are different and therefore your plot is wrong.