Drawing a parabolic TGraphAsymmErrors band plot


_ROOT Version: 6.10.04-x86_64-slc6-gcc62-opt
_Platform: lxplus
_Compiler: _NotProvided


Dear experts,

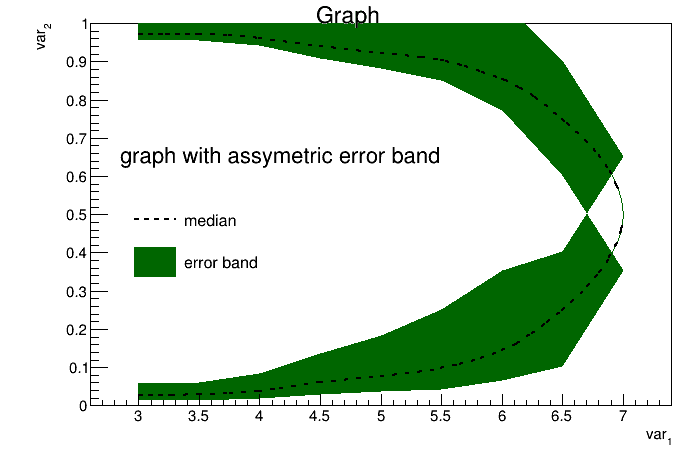
I am trying to draw a plot containing a graph of values and an error band around them through TGraphAsymmErrors class. The problem is that the graph has a like-parabolic shape and for each X-axis value there are two Y-axis median values. This causes a problem to the top X-axis value which is on the right top of the graph. I cannot draw the error band around the top. Here is my macro

band.C (3.1 KB)

and the plot I keep taking back

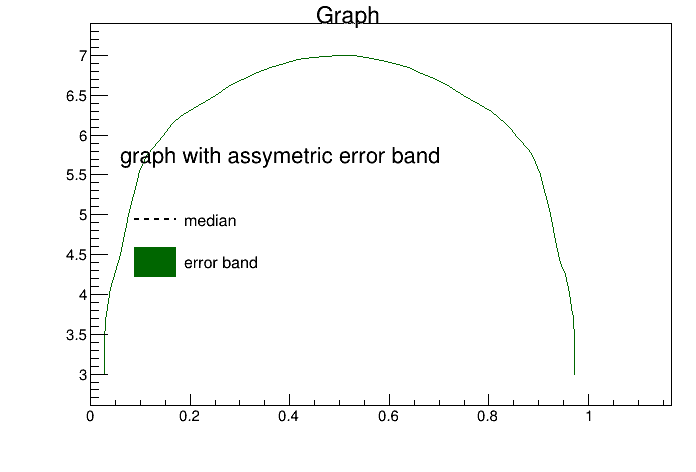
I have tried to apply many solutions that seemed to be logical (like for instance to break the initial parabolic graph to two graphs, an upper and a lower half, both ending and meeting at the biggest X-axis value 7. ), but nothing gives back a nice “normally-looking” result. Is there any idea what is going on? Thank you.

I understood what’s going on. The band drawing assumes the points are plot in in[de]creasing order along X. The 10th point is “going back in X” … which produces this effect. Try to plot only the first 10 points and move interactively the 10th point and you will see what I mean. I do not have any easy solution right now. The only way I see is to split the band in two graphs.

Ok. The splitting into two halfs is what I have done so far resulting to a plot closest to the ideal. Thanks for your time.

How about transposing it and plotting var 1 vs var2?

I am not sure I follow. I believe transposing is possible for histograms, right?

Just switch X and Y:

auto g_transpose = new TGraphAsymmErrors(17, median, mass, minus, plus, 0, 0);

Thank you, ksmith. It seems a nice idea. I added these two lines

auto g_transpose = new TGraphAsymmErrors(17, median, mass, minus, plus, 0, 0);
g_transpose->SetLineColor(kGreen+3); g_transpose->SetFillColor(kGreen+3);

and I have drawn g_transpose instead of gr_band

g_transpose->Draw(“AC 3”);

This is what I took back

It seems I cannot draw the error band around it. Any clue why?

You need also to change the range setting part. If I let the automatic range computing do its job I get the band.

//  TGraphAsymmErrors* gr_band = new TGraphAsymmErrors(17,mass,median,0,0,minus,plus);
  TGraphAsymmErrors* gr_band = new TGraphAsymmErrors(17,median,mass,0,0,plus,minus);

//  gr_band->GetYaxis()->SetRangeUser(0.0,1.0); gr_band->GetXaxis()->SetRangeUser(300.,1100.);
//  gr_band->GetXaxis()->SetTitle("var_{1}");   gr_band->GetYaxis()->SetTitle("var_{2}");
//  gr_band->GetYaxis()->SetTitleOffset(1.2);   gr_band->GetXaxis()->SetTitleOffset(1.2);
  gr_band->SetLineColor(kGreen+3);            gr_band->SetFillColor(kGreen+3);

  gr_band->Draw("A 3");

1 Like

Hello, couet. In retrospective it was an obvious mistake. Thank you all very much for your ideas.

1 Like

This topic was automatically closed 14 days after the last reply. New replies are no longer allowed.