Hi, I’m using the “glbox” option to draw a 3D histogram, and it looks really great. Only I can’t seem to get root to draw boxes with colors that vary based on bin content, instead of the standard system of drawing boxes with size based on bin content. I only really need two colors, because my bins only have values 1 or 2. Any ideas on how to do this? Thanks so much!
This is not implemented right now. But we surely can consider a such extension. Timur will give his input on this.
[quote=“cgreen”]Hi, I’m using the “glbox” option to draw a 3D histogram, and it looks really great. Only I can’t seem to get root to draw boxes with colors that vary based on bin content, instead of the standard system of drawing boxes with size based on bin content. I only really need two colors, because my bins only have values 1 or 2. Any ideas on how to do this? Thanks so much![/quote]May be you can use root.cern.ch/root/html522/TPolyMarker3D.html . You can define two sets of the markers, and assign the different size / style / color to distinguish them (see $ROOTSYS/tutorials/graphics/tornado.C )
And how do you think, what should be the boxes sizes in this case?
[quote=“tpochep”]
And how do you think, what should be the boxes sizes in this case?[/quote]
I would want the box sizes to all be the same (the dimensions of one 3D bin). Although it would certainly be sufficient if both size and color were changed with bin content - I just think size alone is making it difficult to illustrate some of my histograms.
Thanks so much!
Do you mean that the bin content value should be mapped on both the boxes sizes and boxes colors ? why not … Something similar is done when we draw a 2D surface with the option SURF1 where the bin content value is mapped on both the height and the color.
It would be great to be able to experiment with 1) Mapping bin content only to box color and 2) Mapping bin content both to box color and box size. I really think color can help in the same way as it does with SURF1 - it can make a complex diagram easier to read.
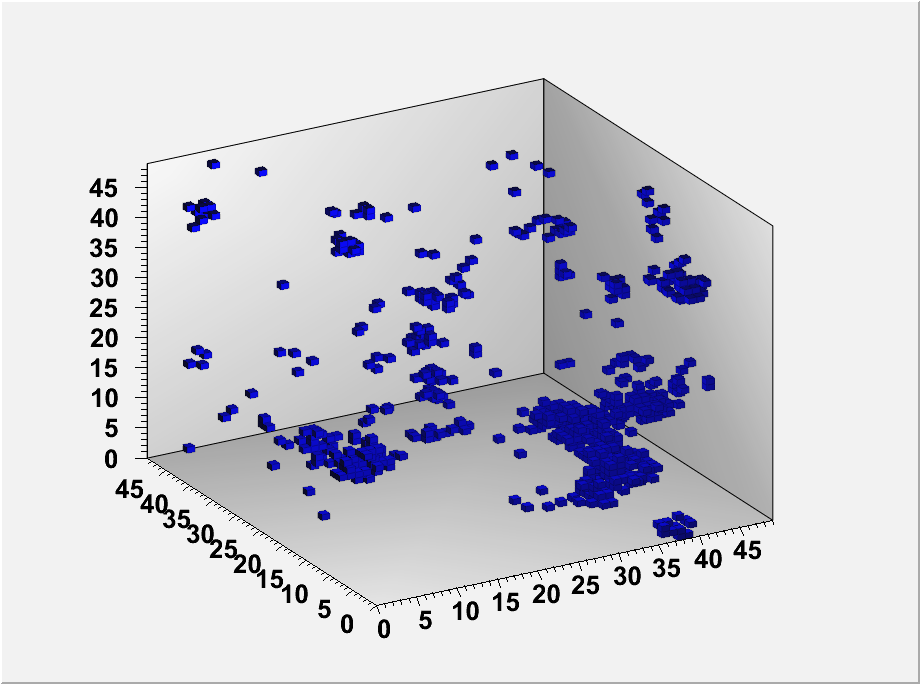
Just to give an example of what I’m working with, I’ve attached an image of a 3D histo drawn using glbox. I’m using the histogram to simulate the growth of fissures in blood vessels in brains (these are strokes that occur in Alzheimer’s Disease patients). Each box corresponds to one fissure. Every cluster in the diagram has an initial fissure and subsequent fissures and I want to be able to show clearly where the initial fissure was.
I’ll also try using TPolyMarker3D as Valeri suggested, but since I’m carrying all the information in a histogram I figured it would be easier to just draw it directly using glbox.
Thanks again for the help!
Mapping it to the color only (like the col option for 2d histos) might be difficult if the boxes have the size of the bin cell because the front boxes will hide the back ones. Or we should have a convention to define the box size. The 2nd option looks more realistic seems to me. Timur what do you think ?
It would probably also be acceptable to be able to plot two different 3D histograms (with different colors) with the “glbox” option on the same canvas using the “same” option. Right now when I try plotting the second histogram, the first one is no longer visible.
Yes, the “SAME” option would solve also you problem. We will implement that.
Timur has a bad internet connection right now. He will be back on a good one after June 4th. He sent me an email saying that he will look at this as soon as possible.
Thanks so much for all your help! This is going to be extremely beneficial for my work.